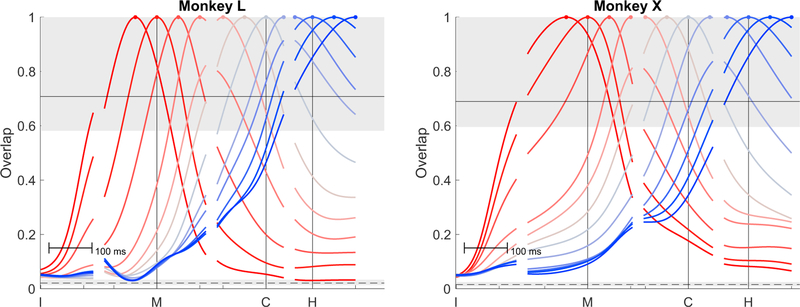
Figure 6. Fractional Overlap of LO PC Subspaces.
For each of the 13 selected time points illustrated in Figure 5, fractional overlap of the of the LO variance derived at that time point with the LO variance at every other time point is shown as a function of time. The subspace at each selected time point overlapped most with the subspaces at nearby time points and decreased progressively with increasing temporal separation both before and after. Colors are arbitrary and unrelated to colors used in Figures 1, 2, 3, 4, and 5. The range of expected overlaps if two subspaces were sampled randomly from the same fixed, global LO space is shown with the upper shaded region (95% limit) and solid line (median). The range of expected overlaps for two completely unrelated subspaces randomly sampled from an N-dimensional space is shown with the lower shaded region (95% limit) and dashed line (median). See STAR Methods for further details.

