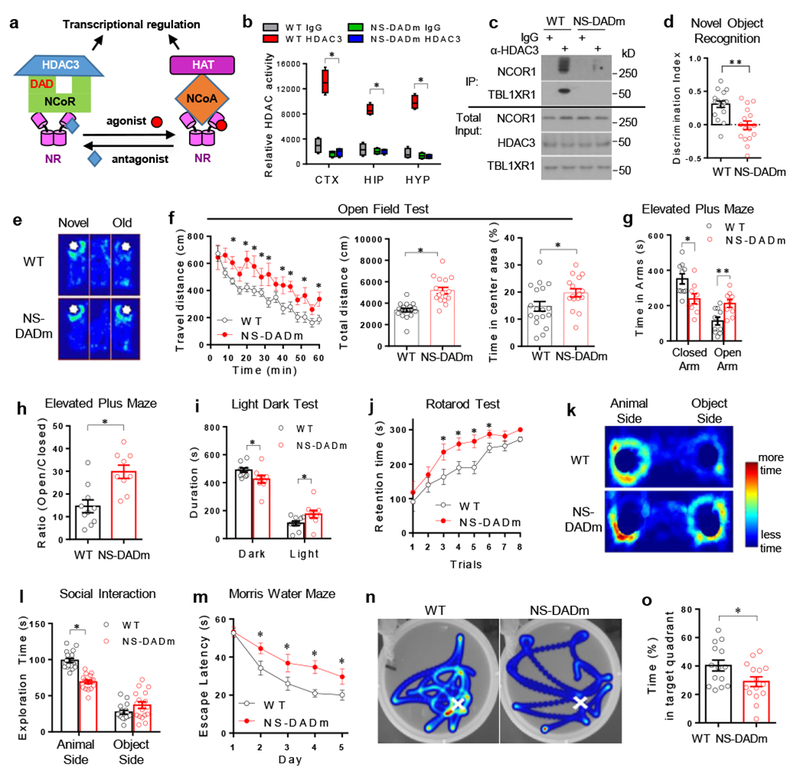
Figure 1. NS-DADm mice display cognitive dysfunction, altered anxiety, and social avoidance.

. (a) The Deacetylase Activation Domain (DAD) in NCOR mediates transcriptional regulation by nuclear receptors (NR), which counteracts with coactivators (NCOA) and histone acetyltransferases (HAT). (b) Fluorescence-based HDAC enzyme assay using lysates of mouse brain cortex (CTX), hippocampus (HIP), and hypothalamus (HYP) after immunoprecipitation with HDAC3 antibody or normal IgG. Box plots center line, median; box limits, upper and lower quartiles; whiskers, minimal and maximum values. 2-way ANOVA analysis was used followed by post hoc Tukey test. n=4 mice for each group. (c) Western blot of proteins associated with HDAC3 in HDAC3 immunoprecipitates (IP). The experiement was repeated independently once with similar results. n=4 mice per group. Male 4 months-old mice were used. The blot images have been cropped. (d) Discrimination index in Novel Object Recognition (NOR) test. Data was analyzed by two-tailed unpaired t test. nWT=18, nNS-DADm=16 mice. Male 4 months-old mice were used. (e) Representative heat map of NOR test. White spots indicate novel or old objects in a 3-chamber box. Time duration that a mouse spent in exploring each object was denoted by color from dark blue (less time) to light blue (more time). (f) Open field test. Data was analyzed by one-way repeated ANOVA and two-tailed unpaired t test. nWT=18, nNS-DADm=16 mice. Male 4 months-old mice were used. (g) Elevated plus maze test. Data was analyzed by two-tailed unpaired t test. nWT=10, nNS-DADm=9 mice. Male 4 months-old mice were used. (h) Time ratio in Elevated plus maze test. Data was analyzed by two-tailed unpaired t test. nWT=10, nNS-DADm=9 mice. Male 4 months-old mice were used. (i) Light-dark test. Data was analyzed by two-tailed unpaired t test. nWT=10, nNS-DADm=9 male 4 months-old mice. (j) Rotarod test. Data was analyzed by one-way repeated ANOVA. nWT=18, nNS-DADm=16 male 4 months-old mice. (k-l) Social interaction test representative heat map and statistics. 2-way ANOVA analysis was used followed by post hoc Tukey test. nWT=17, nNS-DADm=17 male 4months-old mice (m) Time spent before reaching the hidden platform in Morris Water Maze test (MWM). One-way repeated ANOVA analysis was used. nWT=13, nNS-DADm=14 male 4 months-old mice. (n-o) Representative heat map and time spent in the target quadrant during MWM test after the hidden platform was removed from the original location (indicated by white crosses). Data was analyzed by two-tailed unpaired t test. nWT=13, nNS-DADm=14 male 4 months-old mice. Data are expressed as mean ± S.E.M. For detailed statistics results, see Supplementary Table 1. * P ≤ 0.05 is set as significance.
