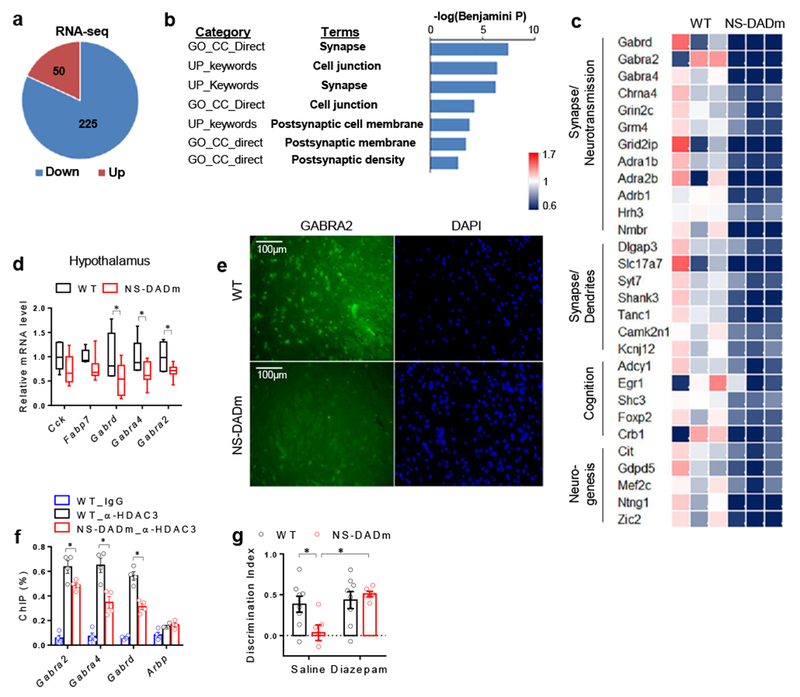
Figure 2. NCORs regulate GABAA receptor gene expression in the hypothalamus.

. (a) Upregulated (Up) or downregulated (Down) genes in the hypothalamus of the NS-DADm mice compared to control littermate, as identified by RNA-seq analysis. 3 biological replicates in each group. DESeq2 (version 1.8.2) was used to normalized the read counts and perform differential gene analysis with a threshold of 5% false discovery rate (FDR). (b) Gene ontology (GO) analysis of differentially expressed genes, showing top enriched pathway clusters. DESeq2 (version 1.8.2) was used to normalized the read counts and perform differential gene analysis with a threshold of 5% FDR. n = 3 mice for each group. (c) Heat map of top differentially expressed gene. (d) RT-qPCR analysis of mRNA of hypothalamus from WT and NS-DADm mice. Box plots center line, median; box limits, upper and lower quartiles; whiskers, minimal and maximum values. Data was analyzed by two-tailed unpaired t test. nWT=6, nNS-DADm=8 male 4 months-old mice. (e) Immunostaining of GABAA receptor α2 subunit (GABRA2) in the lateral hypothalamus. The experiment was repeated independently once with similar results. n=4 mice for each group. (f) ChIP-qPCR analysis. The experiment was repeated independently once with similar results. Data was analyzed by two-tailed unpaired t test. n=4 samples for each group, with 3 male 4 months-old mice pooled in each sample. (g) Novel Object Recognition (NOR) test in NS-DADm mice after i.c.v. administration of diazepam, a positive modulator of GABAA receptors. Data was analyzed by 2-way ANOVA followed by post hoc LSD test. nWT_Vehicle=8, nNS-DADm_Vehicle=6, nWT_Diazepam=8, nNS-DADm_Diazepam=6 female 4 months-old mice. Data is expressed as mean ± S.E.M. For detailed statistics results, see Supplementary Table 1. * P ≤ 0.05 is set as significance.
