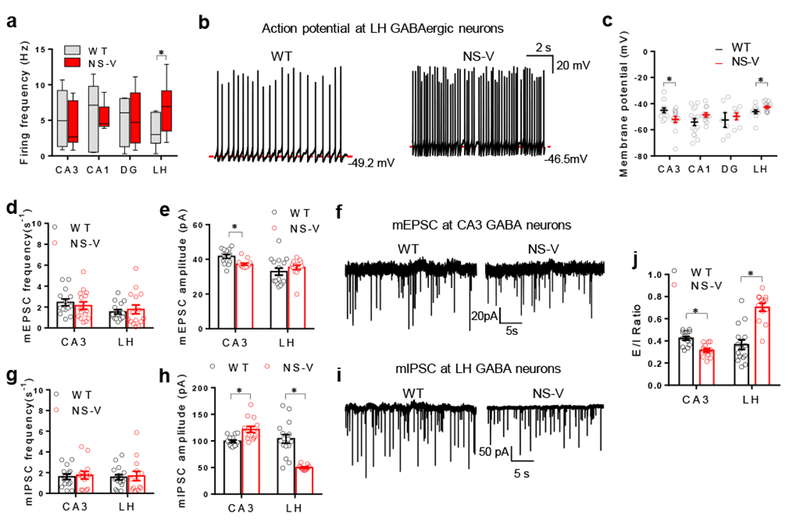
Figure 4. NCORs control the excitation/ inhibition (E/I) balance of LH GABAergic neurons.

. (a-c) Spontaneous firing frequency, representative traces, and resting membrane potential of GABAergic neurons in the hippocampus CA3, CA1, dentate gyrus (DG), and the lateral hypothalamus (LH) of the NS-V mice and Vgat-Cre control (referred to as wild-type, WT). Box plots center line, median; box limits, upper and lower quartiles; whiskers, minimal and maximum values. The experiment was repeated independently once with similar results. 2 months-old male mice were used. 2-way ANOVA analysis was used. Firing Frequency: CA3: nWT=8 neurons/2 mice, nNS-V= 6 neurons/2 mice; CA1: nWT=7 neurons/2 mice, nNS-V=7 neurons/2 mice; DG: nWT=4 neurons/2 mice, nNS-V=5 neurons/2 mice; LH: nWT=7 neurons/2 mice, nNS-V=14 neurons/2 mice. Membrane Potential: CA3: nWT=12 neurons/2 mice, nNS-V=13neurons /2 mice; CA1: nWT=15 neurons/2 mice, nNS-V=12 neurons/2 mice; DG: nWT=6 neurons/2 mice, nNS-V=7 neurons/2 mice; LH: nWT=11 neurons/2 mice, nNS-V=15 neurons/2 mice. (d-f) Frequency, amplitude, and representative traces of mEPSCs of GABAergic neurons in CA3 and LH of the NS-V mice and Vgat-Cre control mice. 2months-old male mice were used. 2-way ANOVA analysis was used. mEPSC Frequency: CA3: nWT=14 neurons/2 mice, nNS-V=15 neurons/2 mice; LH: nWT=15 neurons/2 mice, nNS-V=15 neurons/2 mice; mEPSC amplitude: CA3: nWT=14 neurons/2 mice, nNS-V=15 neurons/2 mice; LH: nWT=15 neurons/2 mice, nNS-V=15 neurons/2 mice. (g-i) Frequency, amplitude, and representative traces of mIPSCs of GABAergic neurons in CA3 and LH of the NS-V mice and Vgat-Cre control. Male 2 months-old mice were used. 2-way ANOVA analysis was used. mIPSC Frequency: CA3: nWT=14 neurons/2 mice, nNS-V=13 neurons/2 mice; LH: nWT=16 neurons/2 mice, nNS-V=13 neurons/2 mice; mIPSC amplitude: CA3: nWT=14 neurons/2 mice, nNS-V=13 neurons/2 mice; LH: nWT=16 neurons/2 mice, nNS-V=13 neurons/2 mice. (j) Excitation/Inhibition (E/I) ratio (ratio of mEPSC amplitude versus mIPSC amplitude). Male 2 months-old mice were used. 2-way ANOVA analysis was used. E/I ratio: CA3: nWT=14 neurons/2 mice, nNS-V=13 neurons/2 mice; LH: nWT=16 neurons/2 mice, nNS-V=13 neurons/2 mice; mIPSC amplitude: CA3: nWT=14 neurons/2 mice, nNS-V=13 neurons/2 mice; LH: nWT=15 neurons/2 mice, nNS-V=13 neurons/2 mice. Data is expressed as mean ± S.E.M. For detailed statistics results, see Supplementary Table 1. * P ≤ 0.05 is set as significance. Independently, the electrophysiological data was re-analyzed using the linear mixed-effects models (Supplementary Table S2).
