Figure 4.

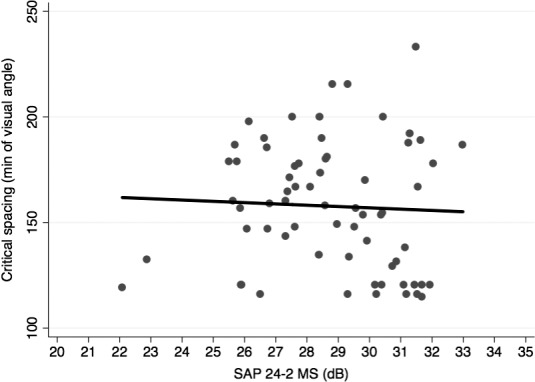
Scatterplot illustrating the relationship between critical spacing and standard automated perimetry (SAP) 24-2 mean sensitivity (MS).

Scatterplot illustrating the relationship between critical spacing and standard automated perimetry (SAP) 24-2 mean sensitivity (MS).