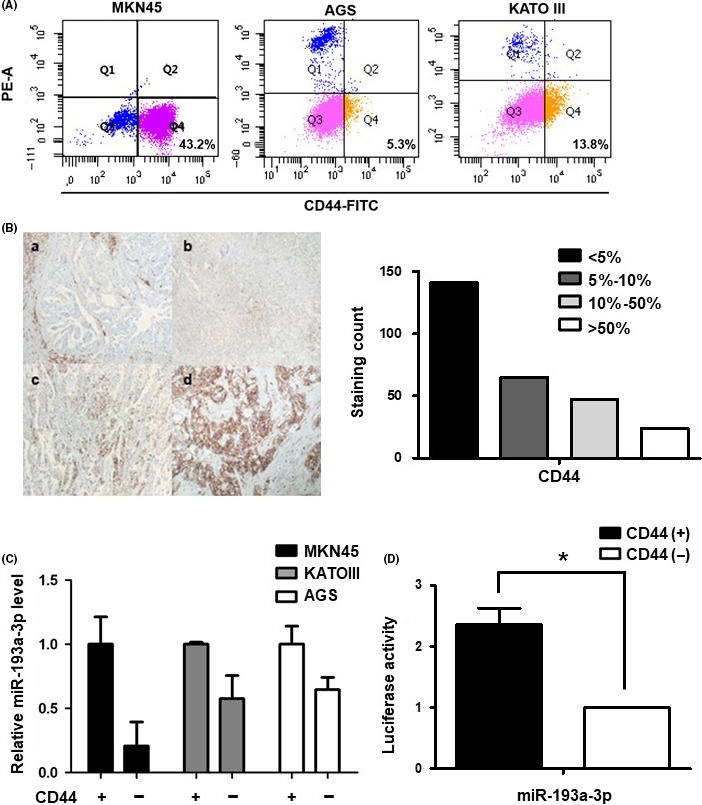
Figure 1.

Expression of microRNA (miR)‐193a‐3p in CD44(+) and CD44(−) gastric cancer cells. A, CD44 expression analysis in MKN45, AGS and KATO III by FACS. B, Left panel; Immunohistochemistry analysis of CD44 expression in representative tumor tissues (a, CD44‐negative expression, the staining area in less than 5% of entire tumor. b, CD44‐one positive expression means that CD44 1+, weak staining in 5‐10% of cells. c, CD44‐two positive expression means that CD44 2+, moderate staining in 10%‐50% of cells. d, CD44‐three positive expression means that CD44 3+, strong staining in more than 50% of cells. Original magnification ×200). Right panel; Distribution of CD44 immunoexpression in tumor tissue from 277 patients. Tumor samples were classified into four groups (<5% [n = 141], 5%‐10% [n = 65], 10%‐50% [n = 47] and >50% [n = 24]) based on the percentage of CD44 immunostaining. C, Real‐time PCR analysis of the expression of miR‐193a‐3p in three cell lines: MKN45, KATO III and AGS. Cells were sorted according to the presence of CD44 by FACS. Level of miR‐193a‐3p was normalized by β‐actin and is presented as the relative ratio. D, Luciferase activity assay to examine the activity of miR‐193a‐3p in CD44(+) and CD44(−) MKN45 cells. Data are expressed as a ratio of Firefly to Renilla luciferase activity. Each treatment was carried out in triplicate (*P < .05)
