
Figure 7.
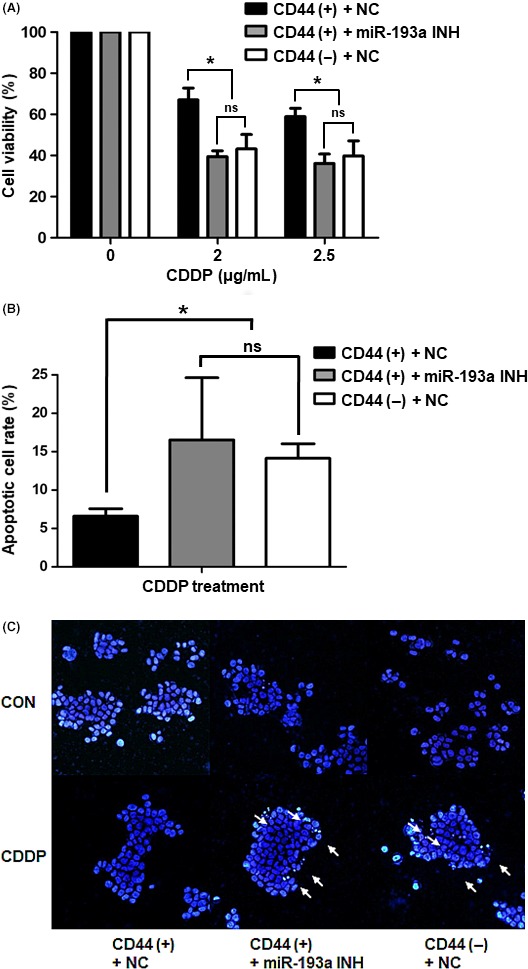
Cisplatin resistance in CD44(+), CD44(–) and microRNA (miR)‐193a‐3p‐inhibited CD44(+) cells. A, MTS assays of cell viability after cisplatin treatment (2 or 2.5 μg/mL) of negative control‐transfected CD44(+), negative control‐transfected CD44(−) and miR‐193a‐3p inhibitor‐transfected CD44(+) MKN45 cells. Values shown represent averages of relative control cell viabilities; each experiment was carried out in triplicate (*P < .05). B, Apoptosis measurements in negative control‐transfected CD44(+), negative control‐transfected CD44(−) and miR‐193a‐3p inhibitor‐transfected CD44(+) MKN45 cells after cisplatin treatment (3 μg/mL). Cells were stained with annexin V and propidium iodide and analyzed by flow cytometry. Values represent average rates of apoptosis in each cell type, from triplicate experiments (*P < .05). C, Fluorescence images of representative nuclei from negative control‐transfected CD44(+), negative control‐transfected CD44(−) and miR‐193a‐3p inhibitor‐transfected CD44(+) MKN45 cells. Nuclei were stained with DAPI to observe their morphologies. White arrows indicate apoptotic bodies. CDDP, cisplatin; CON, control; miR‐193a INH, miR‐193a‐3p inhibitor; NC, negative control; ns, not significant