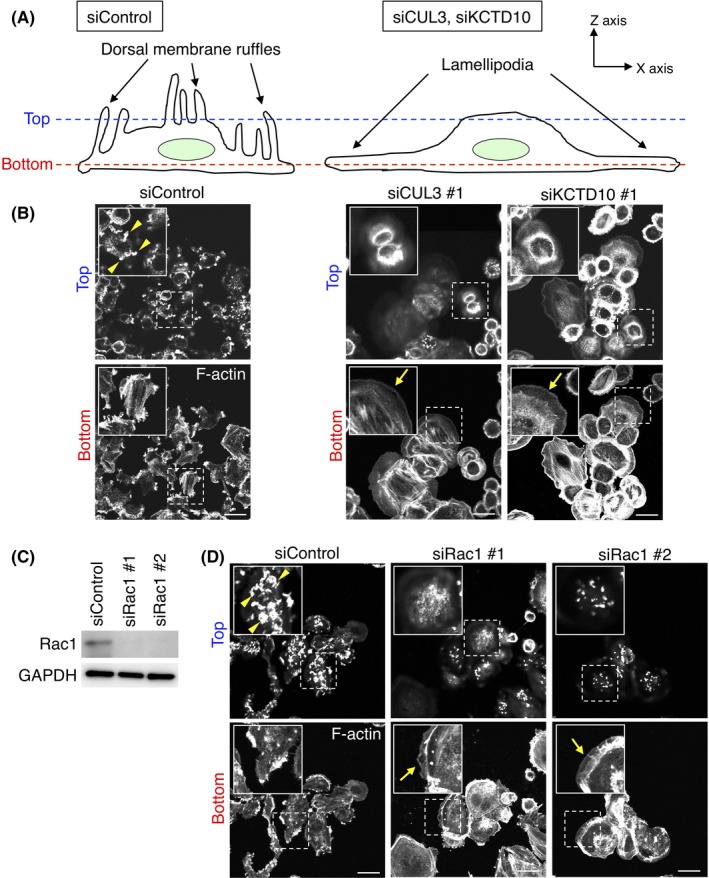
Figure 4.

Visualization of F‐actin in cullin‐3 (CUL3)‐, KCTD10‐ or Rac1‐depleted SKBR‐3 cells. A, Schematic diagrams of control and CUL3‐ or KCTD10‐depleted cells. Confocal images in (B, D) were obtained at the top or bottom sections of cells. B, F‐actin staining by phalloidin in CUL3‐ or KCTD10‐depleted SKBR‐3 cells 15 min after epidermal growth factor (EGF) stimulation. Confocal images at the top and bottom sections of cells are shown. Inset: magnifications of the area indicated by a dashed square. Representative F‐actin‐positive dorsal membrane ruffles and lamellipodia are indicated by yellow arrowheads and arrows, respectively. Bars, 20 μm. C, Western blots of SKBR‐3 cell lysates, 72 h post‐transfection with siRNAs. D, F‐actin staining by phalloidin in Rac1‐depleted SKBR‐3 cells 15 min after EGF stimulation. Confocal images at the top and bottom sections of cells are shown. Inset: magnifications of the area indicated by a dashed square. Representative F‐actin‐positive dorsal membrane ruffles and lamellipodia are indicated by yellow arrowheads and arrows, respectively. Bars, 20 μm
