. 2019 Feb 4;8:e41541. doi: 10.7554/eLife.41541

Figure 4. The local transition probability model accounts for modulations of late MEG signals.

Observed MEG signals and theoretical surprise levels predicted by the transition probability model (with a local integration, ω = 6) in response to (A) globally rare events and to (B) violation or continuation of local patterns. MEG signals correspond to activity levels across sensors were averaged using a topographical filter (see Figure 3—figure supplement 1) within a late time window (from 500 to 730 ms) post-stimulus onset. The patterns reported here correspond to the diagnostic ones that are highlighted in Figure 3. See Figure 4—figure supplement 1 for theoretical predictions by other models.

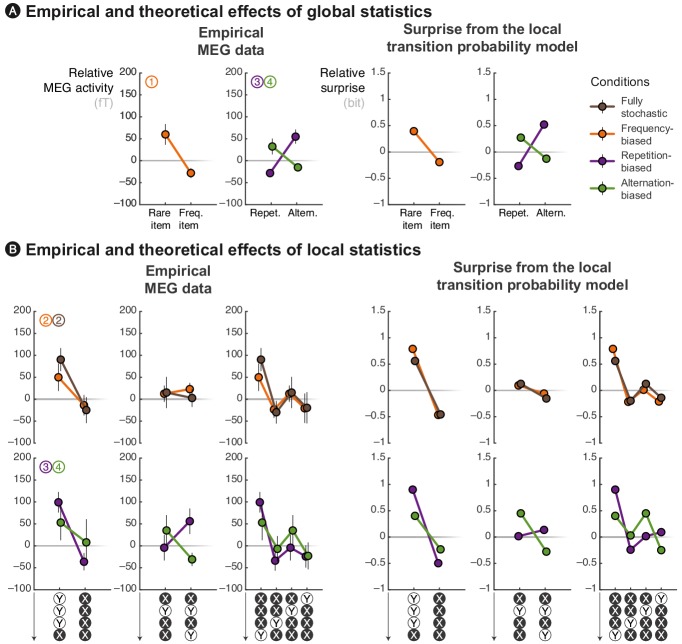
Figure 4.

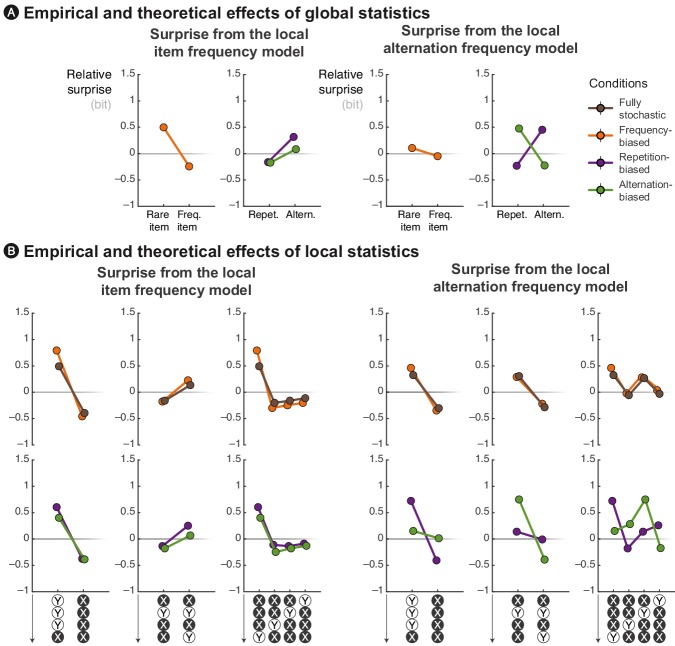
Figure 4—figure supplement 1. Qualitative account of experimental effects by rival models.

Figure 4—figure supplement 1.

Theoretical surprise levels from the item frequency and alternation frequency models (with a local integration, ω = 6) in response to (A) globally rare events and to (B) violation or continuation of local patterns. The local patterns reported here correspond to diagnostic ones that are highlighted in Figure 3. Surprise levels from the transition probability model is presented along empirical data in Figure 4. Both IF and AF models fail to account for some key aspects of the data. For instance, the IF model does not reproduce the modulation of MEG signals by globally rare repetitions/alternations and the violation of local pattern of alternations. Conversely, the AF model does not reproduce the modulatory effect of frequent/rare items and the violation of local pattern of repetitions.