
Figure 1. Scheme of the core nitrogen metabolic network of M. tuberculosis.
1 – Glutamine synthetase (glnA1); 2 – glutamate synthase (gltBD); 3 – glutamate dehydrogenase (gdh); 4 – glutamate/oxaloacetate transaminase (aspB); 5 – glutamate/pyruvate transaminase (aspC); 6 – alanine dehydrogenase (ald); 7 – glutamate decarboxylase (gadB); 8 – aspartate/pyruvate transaminase (aspC); 9 – asparaginase (ansA). Scheme was constructed with data from the Kyoto Encyclopedia for Genes and Genomes (https://www.genome.jp/kegg/kegg2.html) and Mycobrowser (https://mycobrowser.epfl.ch/), and manually curated.

Figure 1—figure supplement 1. Common bacterial transcriptional regulators involved in nitrogen metabolism are not present in M. tuberculosis.
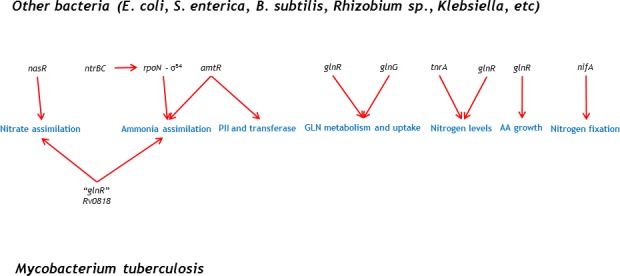
A glnR homologue (Rv0818) is found in mycobacteria, nonetheless, its function is different from what has been shown in other species.
Figure 1—figure supplement 2. Different growth kinetics displayed by M. tuberculosis (orange circles) and M. smegmatis (purple circles) where NH4+is the sole nitrogen source.
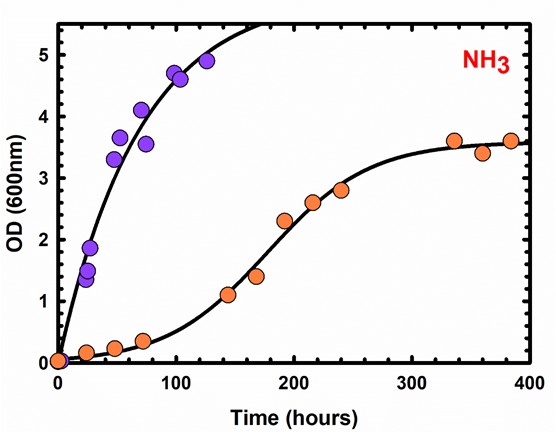
Each symbol represents a measurement from one independent experiment. Data is representative of two independent experiments.