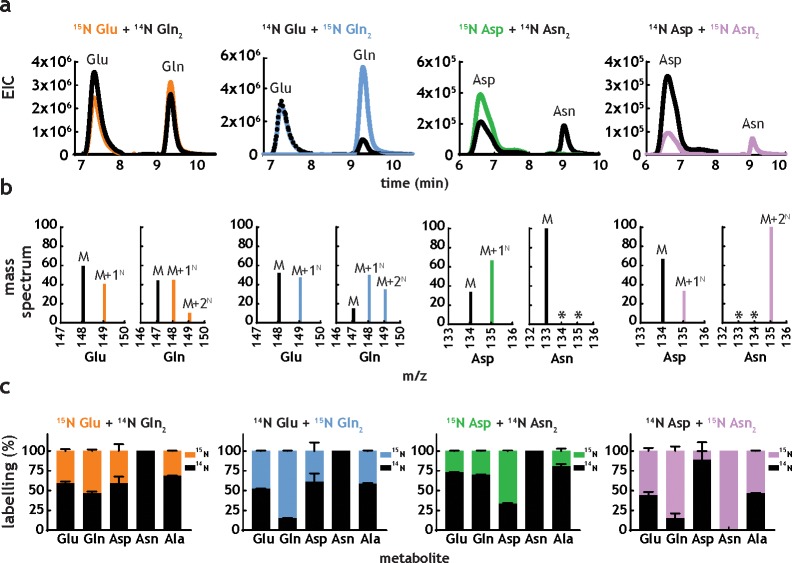
Figure 5. M. tuberculosis co-metabolises nitrogen sources.
(a) Representative extracted ion chromatograms (EICs) for intracellular metabolites from cultures obtained in the presence of dual nitrogen sources (Glu + Gln or Asp +Asn), with one of the nitrogen sources 15N-labelled. (b) Representative mass spectra corresponding to the metabolites in Figure 5a. The following m/z values were used in positive mode (M + H)+: Glu – 148.0604, 15N-Glu – 149.0575, Gln – 147.0764, 15N-Gln – 148.0735, 15N2-Gln – 149.0705, Asp – 134.0448, 15N-Asp – 135.0418, Asn – 133.0608, 15N-Asn – 135.0578, and 15N2Asn – 135.0548. (c) Combined labelling data obtained for the same metabolites, in different combinations of two carbon sources. Bars are averages of three biological replicates, colour indicates labelled metabolites/nitrogen sources and error bars are the standard error of the mean.
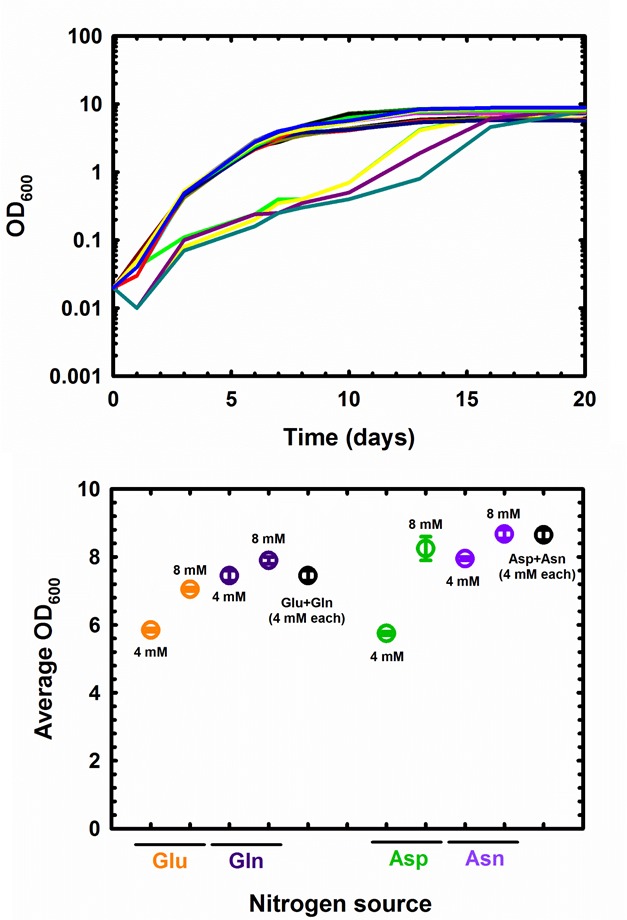
Figure 5—figure supplement 1. Growth of M. tuberculosis in single or dual nitrogen sources.


