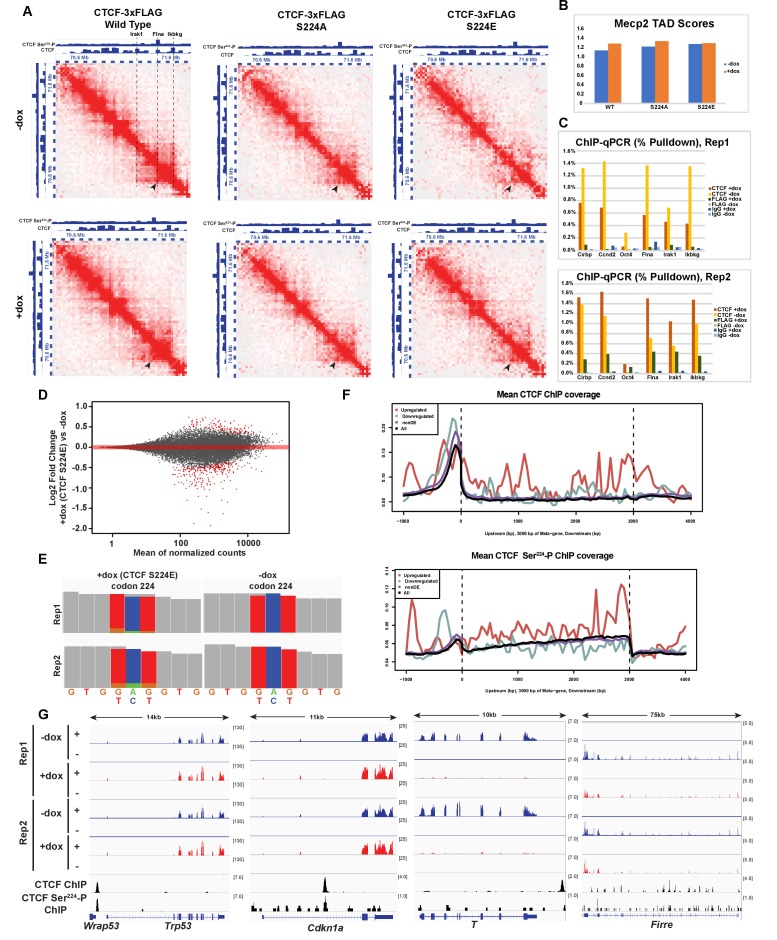
Figure 8. Impact of overexpression of CTCF, S224A and S224E on three-dimensional chromatin structure and gene expression.
(A) Hi-C2 interaction maps at 25 kb resolution of the Mecp2 TAD in F1-2.1 mESCs carrying dox-inducible wild type, S224A or S224E CTCF-3xFLAG transgenes grown for 2 days with (bottom) and without (top) doxycycline. CTCF and CTCF Ser224-P ChIP-seq tracks are shown for comparison. Black arrows indicate the left border of a sub-TAD domain bound at both borders by CTCF and at one border by CTCF Ser224-P. In addition, dotted lines and text in the WT -dox Hi-C2 interaction map indicate locations of ChIP-qPCR primers used in (C), with the Irak1 and Ikbkg lines also indicating the borders of the Mecp2 TAD scored in (B). (B) TAD scores for the Mecp2 TAD for the Hi-C2 interaction maps in A, with higher TAD score indicating a stronger TAD. (C) CTCF and FLAG ChIP-qPCR (% Pulldown) in F1-2.1 mESCs carrying dox-inducible S224E CTCF-3xFLAG grown for 2 days with or without doxycycline. Cirbp and Ccnd indicate positive control regions for CTCF binding, while Oct4 indicates a negative control region. Flna, Irak1, and Ikbkg regions are as indicated in (A). (D) MA plot of RNA-seq expression changes in F1-2.1 mESCs carrying dox-inducible CTCF S224E transgene after 6 days of dox induction. Points in red are DE genes (adjusted p-value<0.01). (E) Coverage of RNA-seq reads over codon 224 of CTCF with (left) and without (right) 6 days of dox induction. The number of reads with A (green), C (blue), G (gold), T (red) or N (grey) at positions 1, 2, and 3 of codon 224 are shown. (F) Metagene coverage of CTCF ChIP-seq reads (top) and CTCF Ser224-P ChIP-seq reads (bottom) over upregulated (red), downregulated (green), non differentially expressed (purple) and all (black) genes. (G) RNA-seq, CTCF and CTCF Ser224-P ChIP-seq coverage over two representative upregulated (left) and downregulated (right) genes.

