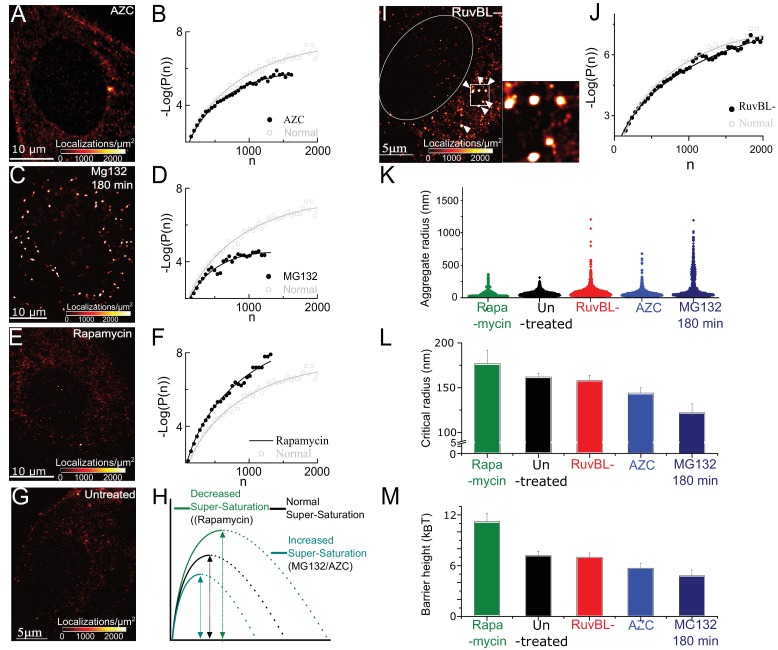
Figure 2. Super-saturation can be tuned by the levels of endogenous aggregative polypeptides.
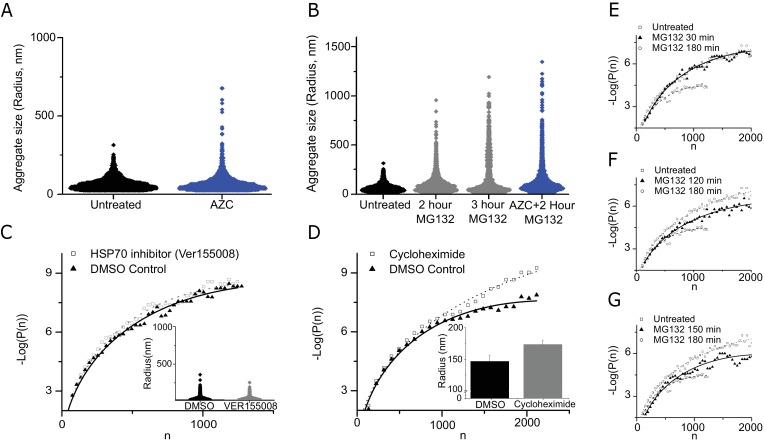
and RuvBL-dependent mechanism clears super-critical clusters: (A–F) Representative super-resolved reconstruction and free energy functional fit for AZC- (A and B), MG132-(C and D), and Rapamycin- (E and F) treated cells. Distribution functions were computed from 2500 to 10,000 clusters from 7 to 10 cells in each condition. Red-hot colour code is used to indicate the relative density of detections in A, C, E. Gray plot in B, D, F represents the functional fit for untreated cells for comparison. (G) Representative super-resolution reconstruction for an untreated cell showing many sub-diffractive aggregates (dark red) but few large aggregates (red hot). (H) Schematic of the observed effects of the different pharmacological treatments. (I) Representative super-resolution reconstruction for a RuvBL depleted cell and zoomed view of large (red hot) aggregates. (J) –Log(P(n)) versus n curve from 7000 clusters from 9 RuvBL depletion cells shows almost no effect on the sub-critical distribution. (K–M), quantification of the effect of the perturbations and comparisons of relative changes in the distributions of aggregate size (violin plot, (K), Rc (L) and the measure nucleation barrier; (M) the range of values in L and M is chosen to illustrate the main differences. Error bars in L and M represent s.e.m in fit estimation (Materials and methods). All cells imaged in this figure were fixed cells. Log refers to the natural log (base ‘e’) (See Figure 2 – figure supplement 1 for combined effect of AZC and MG).


