Figure 4.

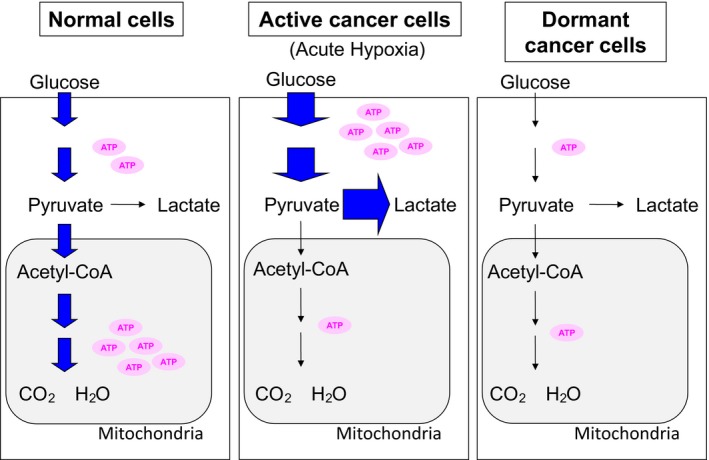
Glycolysis and oxidative phosphorylation in dormant cancer cells. Activation status of the metabolic pathways is expressed as thickening of arrows. Amount of ATP produced is illustrated as the number of ATP molecules

Glycolysis and oxidative phosphorylation in dormant cancer cells. Activation status of the metabolic pathways is expressed as thickening of arrows. Amount of ATP produced is illustrated as the number of ATP molecules