. 2019 Jan 17;8:e42426. doi: 10.7554/eLife.42426

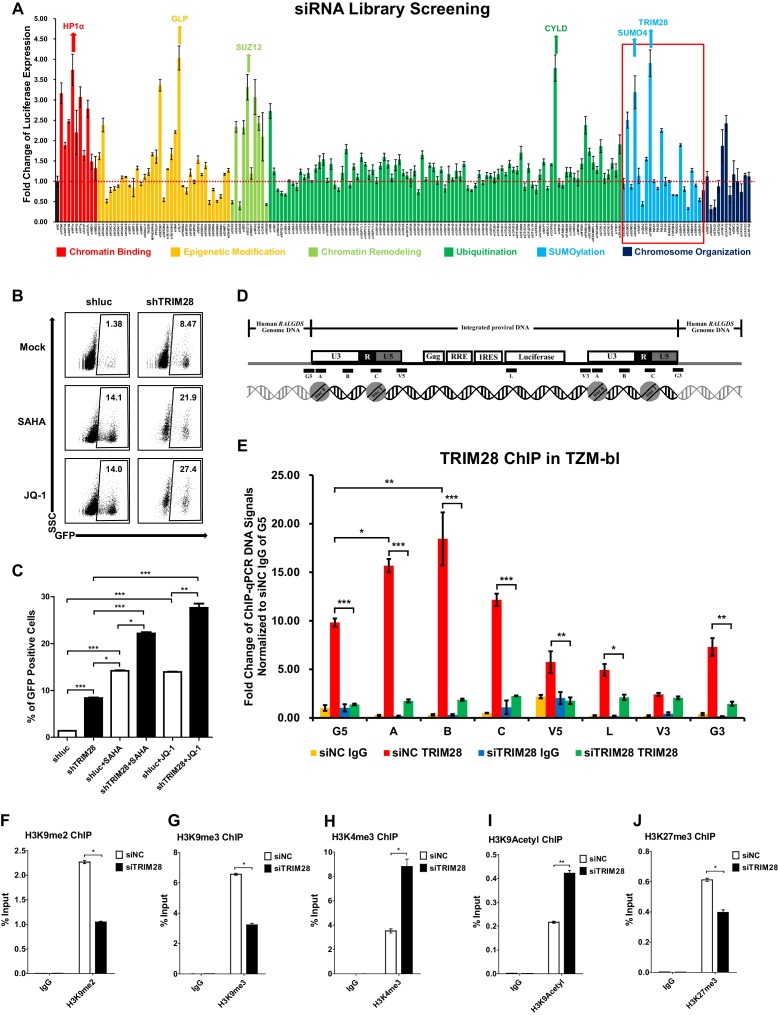
Figure 1. TRIM28 suppresses HIV-1 expression and contributes to HIV-1 latency.

(A) A siRNA library targeting 182 human genes was transfected into TZM-bl cell line, respectively. Three distinct siRNAs targeting each gene were transfected as a mixture. Forty-eight hours post-transfection, cells were harvested and the activity of luciferase from cell lysates was measured. Fold changes were calculated for each gene compared to negative control siRNA (siNC). (B–C) shRNA constructs were packaged into recombinant lentiviruses and infected J-Lat 10.6. The reactivation efficiency was measured by the GFP-positive percentage which was shown in the top right corner. SAHA and JQ-1 were used as positive controls. (D) Eight ChIP-qPCR primers targeting HIV-1 reporter provirus were designed. G5: Cellular DNA and viral 5’LTR junction; A: Nucleosome 0 assembly site; B: Nucleosome-free region; C: Nucleosome one assembly site; V5: Viral 5’LTR and gag leader sequence junction; L: Luciferase region; V3: Viral poly purine tract and 3’LTR junction; G3: Viral 3’LTR and cellular DNA junction. (E) ChIP assay with antibody against TRIM28 was performed in TZM-bl cell line. All the ChIP-qPCR DNA signals were normalized to siNC IgG of G5. (F–J) ChIP assays with antibodies against H3K9me2, H3K9me3, H3K4me3, H3K9Acetyl and H3K27me3 were performed in TZM-bl cell lines. Data represents mean ±SEM in triplicates. p-Values were calculated by Student’s t-test. *p<0.05, **p<0.01, ***p<0.001.

Figure 1.

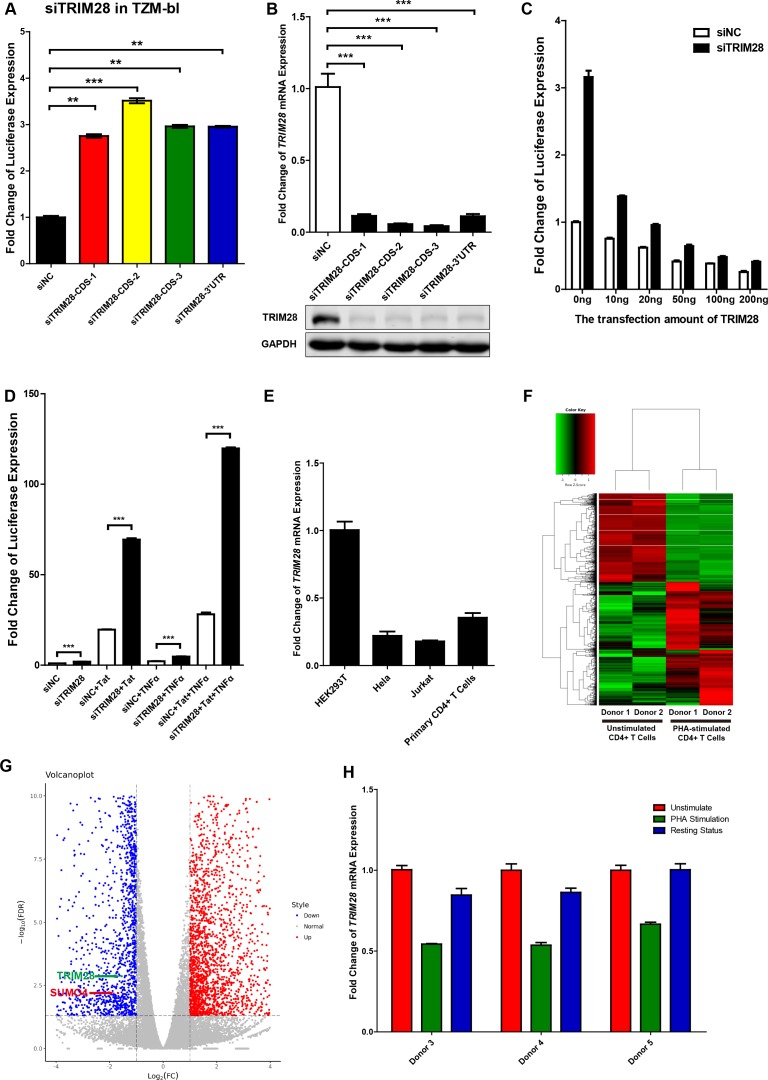
Figure 1—figure supplement 1. TRIM28 suppresses HIV-1 expression and is upregulated upon activation by PHA.

Figure 1—figure supplement 1.

(A) TRIM28 in TZM-bl cells was knocked down by siRNAs targeting the coding sequence and 3’UTR of TRIM28 mRNA. The luciferase from clarified lysates was quantitated and normalized to siNC. Data represents mean ±SEM in triplicates. P values were calculated by Student’s t-test. **p<0.01, ***p<0.001. (B) The knockdown efficiency of different TRIM28 siRNAs was confirmed by qPCR and western blot. Data represents mean ±SEM in triplicates. p-Values were calculated by Student’s t-test. ***p<0.001. (C) Endogenous TRIM28 in TZM-bl cells was knocked down by siRNA targeting 3’UTR or treated with siNC. Different gradients of TRIM28 construct were co-transfected. The luciferase from lysate supernatants was quantitated and normalized to the siNC control which was not co-transfected with TRIM28. (D) Endogenous TRIM28 in TZM-bl cells was knocked down by siRNAs or treated with siNC. HIV-1 Tat construct and TNFα were separately co-treated with siRNAs or joint used with siRNAs. The luciferase from clarified lysates was quantitated and normalized to the siNC which has no additive. Data represents mean ± SEM in triplicates. p-Values were calculated by Student’s t-test. ***p<0.001. (E) The expression of TRIM28 in different cells was quantitated by qPCR and normalized to HEK293T group. β-actin mRNA was set as internal reference. (F–G) Freshly isolated CD4+ T cells from two healthy donors were stimulated with PHA for 2 days or left untreated. Total mRNAs from each group were extracted and proceeded to RNA-Seq. Differentially expressed genes, which were filtered with log2FC of 1 and PvalueFDR cutoff of 0.05, were plotted as heatmap (F) and volcanoplot (G). Arrow-pointed scatters indicated TRIM28 and SUMO4. (H) CD4+ T cells from three healthy donors were stimulated with PHA for 2 days or left untreated. One part of PHA-activated CD4+ T cells was washed for removing PHA and cultured in RPMI1640 which contained low IL-2 for 1 month. Then, resting CD4+ T cells were isolated from long-term cultured CD4+ T cells. Total RNAs from unstimulated (red), PHA-stimulated (green) and resting (blue) CD4+ T cells were extracted and proceeded to qPCR. TRIM28 from each group was quantitated and normalized to unstimulated group. β-actin mRNA was set as internal reference.
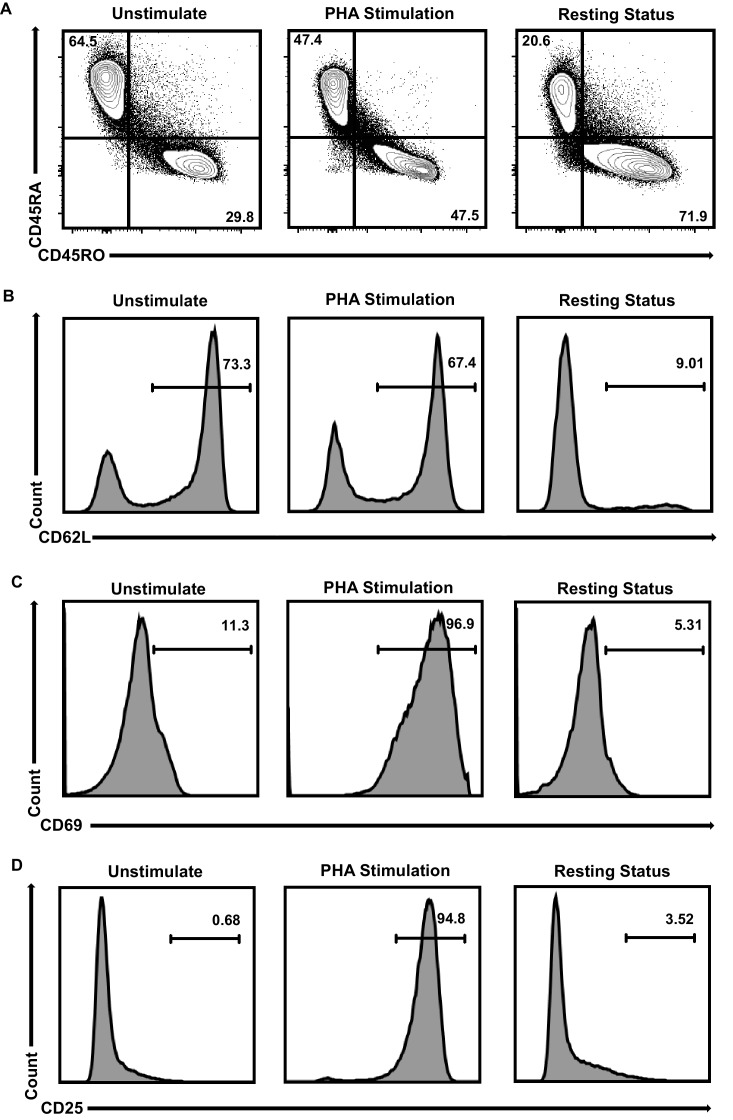
Figure 1—figure supplement 2. Primary CD4+T cells populations’ identities.

Figure 1—figure supplement 2.

(A–D) CD4+ T cells were stimulated with PHA for 2 days or left untreated. One part of PHA-activated CD4+ T cells was washed for removing PHA and cultured in RPMI1640 which contained low IL-2 for 1 month. Then, resting CD4+ T cells were isolated from long-term cultured CD4+ T cells. Both of unstimulated (left panels), PHA-stimulated (middle panels) and resting (right panels) CD4+ T cells were incubated with antibodies against CD4, CD45RA, CD45RO, CD62L, CD69 and CD25, and analyzed by flow cytometry. Most of the unstimulated CD4+ T cells were naïve cells which were CD45RA+/CD45RO-/CD62L+/CD69-/CD25-. After PHA stimulation, CD4+ T cells started to change into CD45RA-/CD45RO+/CD62L- and express high amounts of activation markers CD69 and CD25 which were the identities of activated effector cells. Most of long-term cultured resting CD4+ T cells were CD45RA-/CD45RO+/CD62L-/CD69-/CD25- which were the identities of effector memory CD4+ T cells.
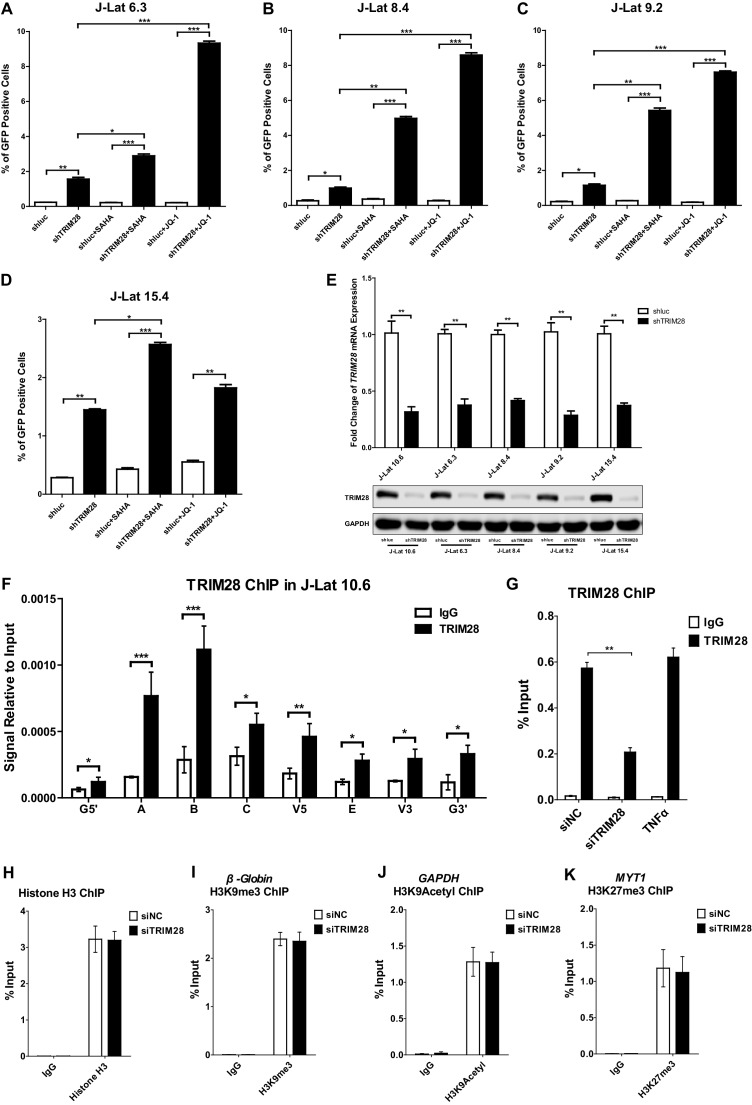
Figure 1—figure supplement 3. TRIM28 contributes to HIV-1 latency and is enriched on HIV-1 LTR.

Figure 1—figure supplement 3.

(A–D) J-lat 6.3, 8.4, 9.2 and 15.4 cell lines were treated as in Figure 1B. The reactivation efficiency for each group was analyzed as in Figure 1C. Data represents mean ±SEM in triplicates. p-Values were calculated by Student’s t-test. *p<0.05, **p<0.01, ***p<0.001. (E) The knockdown efficiency of shTRIM28 in different cell lines was confirmed by qPCR and western blot. (F) ChIP assay with antibodies against TRIM28 and normal rabbit IgG was performed in J-Lat 10.6 cell line. All the ChIP-qPCR DNA signals were normalized to IgG of G5’. Data represents mean ±SEM in triplicates. p-Values were calculated by Student’s t-test. *p<0.05, **p<0.01, ***p<0.001. G5’ represented cellular DNA and viral 5’LTR junction; E represented envelop; G3’ represented viral 3’LTR and cellular DNA junction; A, B, C, V5 and V3 represented as in Figure 1D (Supplementary file 2). (G) ChIP assay with antibodies against TRIM28 and normal rabbit IgG was performed in TZM-bl cell lines which were treated with negative control, TRIM28 siRNAs and TNFα, respectively. Data represents mean ±SEM in triplicates. p-Values were calculated by Student’s t-test. **p<0.01. (H–K) Data represented positive controls of siTRIM28-related ChIP. ChIP assay with antibodies against Histone H3, H3K9me3, H3K9Acetyl, H3K27me3 and normal rabbit IgG was performed in TZM-bl cell lines which were treated with negative control and TRIM28 siRNAs, respectively. For Histone H3 ChIP, ChIP-qPCR DNA signals were normalized to Input of ‘B’ which represented the nucleosome free region of HIV-1 LTR (H). ChIP-qPCR DNA signals were normalized to input of the promoter of β-Globin for H3K9me3 ChIP (I). ChIP-qPCR DNA signals were normalized to input of the promoter of GAPDH for H3K9Acetyl ChIP (J). ChIP-qPCR DNA signals were normalized to Input of the promoter of MYT1 for H3K27me3 ChIP (K).