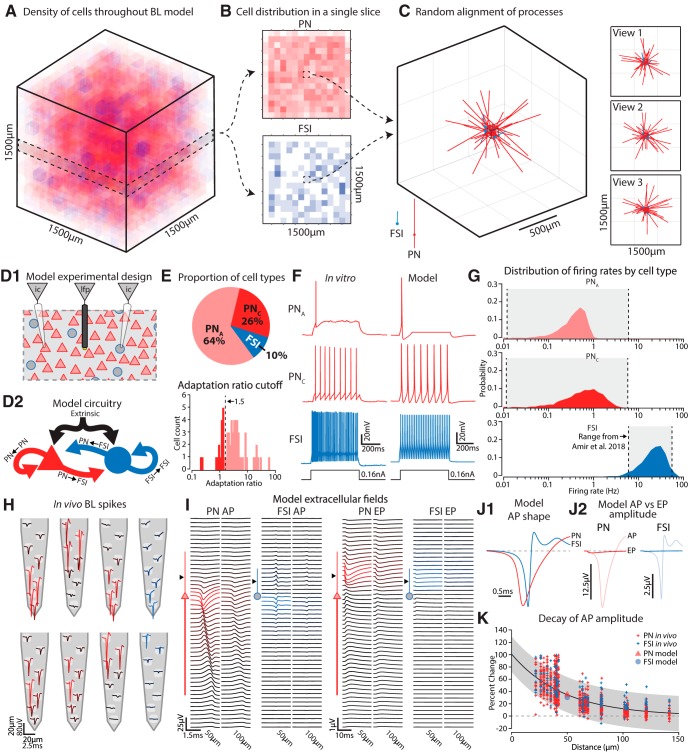
Figure 1.
Construction of a biophysically accurate BL model. A, Our BL model was a cube structure comprised of 27,000 PNs and FSIs randomly distributed throughout. Local cell densities in 100 × 100 × 100 µm cubes (red = PN, blue = FSI) are illustrated for a typical case. For this example, PNs, the densities spanned 0–19,000/mm3 (median = 7000/mm3). FSI densities ranged from 0 to 5000/mm3 (median = 1000/mm3). B, A slice through the model shows the inhomogeneity of cell densities for PNs and FSIs. C, The dendritic processes of the neurons contained in a particular voxel are illustrated. These were randomly oriented and spanned several hundred microns as also shown in the three orthogonal views. D, (1) PNs and FSIs were distributed in space so that they spanned a volume equal to the area of the BL in the rat. Virtual current clamp electrodes (ic) could be placed into any cell, and virtual extracellular electrodes (lfp) could be placed anywhere in the model volume. PNs are indicated by red triangles and FSIs are blue circles. (2) PNs and FSIs were connected among themselves and with each other. Extrinsic glutamatergic afferents fed onto both cell types. Neither FSIs nor PNs formed autapses. E, The relative proportions of the three cell types were determined by patching neurons in BL slices prepared from adult Long–Evans rats, the same age and strain used for our LFP recordings. The cutoff for determining which PNs exhibited adaption was set to 1.5, which was between the two peaks in the distribution of adaptation ratios. F, Example recordings from neurons in the slice receiving current injection were comparable to those of our model neurons. G, The firing rate distributions for neurons in our model overlapped with the mean rates reported from the BL in vivo in a previous study (Amir et al., 2018). H, Example spike waveforms recorded with a silicon probe in vivo. Red traces are from putative PNs, while blue are FSIs. The intensity of the color is scaled to the peak of the spike wave form. I, Left, For both a model PN and FSI we delivered a suprathreshold EPSC to the a-dend and recorded the extracellular AP at different distances along the long axis of the neuron, and either at 50 or 100 µm lateral. Near the cell body the field was negative, and it decayed rapidly with distance. Positive dendritic return currents were evident as well. The FSI extracellular spike wave form was both smaller and faster than the PN’s. Right, Subthreshold stimulation resulted in a much weaker extracellular wave form (note the scale bar) reflecting the EPSC (EP) that was negative going near the stimulated dendritic branch. J, (1) Directly overlaying the extracellular APs from both cell types illustrates that those arising from PNs were much slower than those from FSIs. Amplitudes were rescaled so both spike waveforms occupy the same vertical extent of the graph. (2) AP amplitudes were much stronger than EP amplitudes for both cell types. K, For extracellular APs recorded with silicon probes in vivo, we measured how their amplitudes decayed with distance. The drop in amplitude was fit by an exponential curve (black line). The gray region is the 95% confidence bounds. Measuring the decay in our model extracellular APs along the lateral axis, we found that it fit within the in vivo distribution.

