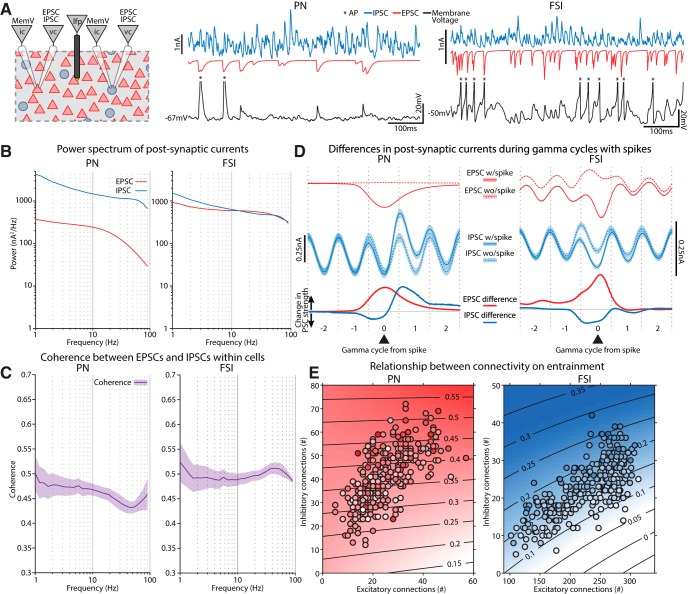
Figure 5.
EPSCs and IPSCs entrained neurons in the gamma band. A, Left, For PNs and FSIs we measured the membrane voltage (ic) and their transmembrane currents while voltage clamped (vc) at the reversal potentials for either EPSCs (0 mV) or IPSCs (−75 mV). Middle, Traces from an example PN. In addition to the transmembrane currents and voltages were recorded, we also bandpass filtered the EPSC and IPSC traces around the gamma peak. Right, Examples traces from an FSI. B, The mean power spectrums of the EPSC and IPSC traces for each cell type. PNs showed greater power for IPSCs across all frequencies compared with EPSCs. FSIs had similar power levels across the spectrum for EPSCs and IPSCs. The spectrum of IPSCs from both cell types contained a bump in the gamma band. C, The coherence of the EPSCs and IPSCs for each cell type. PNs had a dip in coherence around the peak gamma frequency, while FSIs showed a prominence. Shaded regions denote SD. D, Synaptic currents were aligned to the phase of gamma cycles and centered on ones that either had, or did not have, spiking (thin blue and red lines, solid lines from cycles with spikes, dashed for cycles without spikes). The difference in the PSCs between the spike and no spike conditions is shown below (thick red and blue lines). IPSCs were modulated by gamma phase for both cell types, while only FSIs exhibited modulation of their EPSCs to gamma. E, For each cell we plotted the number of excitatory (x-axis) or inhibitory (y-axis) connections they received and their corresponding entrainment. Each scatter point is a different cell. The shaded background is the result of a linear fit that estimates the resultant vector strength based on the number of inhibitory connections, excitatory connections, and their product (interaction term). Contours in black indicate the actual resultant vector values associated with each color.

