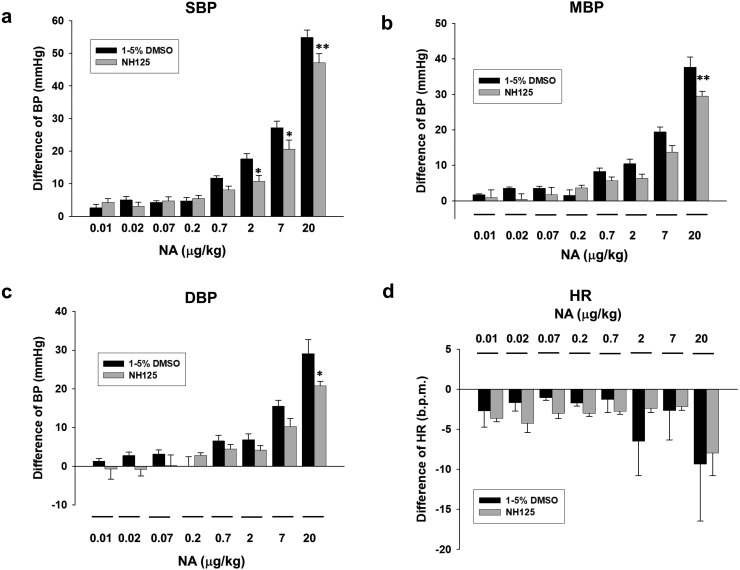
Fig. 6.
Effects of NH125 on NA-induced increase of BP in rats. NA (0.01−20 µg/kg) was cumulatively added 10 min after injection with NH125 (22 µg/kg) or DMSO (control). Bar graph indicated the change of BP [(a) SBP, (b) MBP and (c) DBP] and (d) HR after injection with NA. The results were shown as mean ± SEM [n=6 (DMSO), n=5 (NH125)]. *P<0.05, **P<0.01 vs. DMSO.

