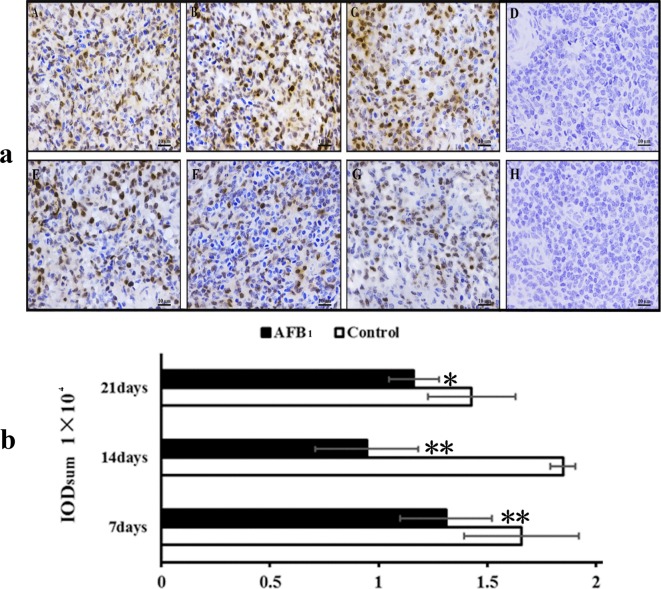
Fig. 4.
Immunohistochemistry of the spleen. a: Expression of PCNA protein by immunohistochemistry in the spleen. b: Integrated optical density (IOD sum) of PCNA protein expression in the spleen. Notes: A, B, and C showing the control group at 7, 14, and 21 days respectively; E, F, and H showing the AFB1 group at 7, 14, and 21 days respectively; D and H showing negative control in the control group and the AFB1 group respectively. Bars = 10 μm. Data are presented with the mean ± standard deviation (n = 10). * means p<0.05 compared with the control group, ** means p<0.01 compared with the control group.

