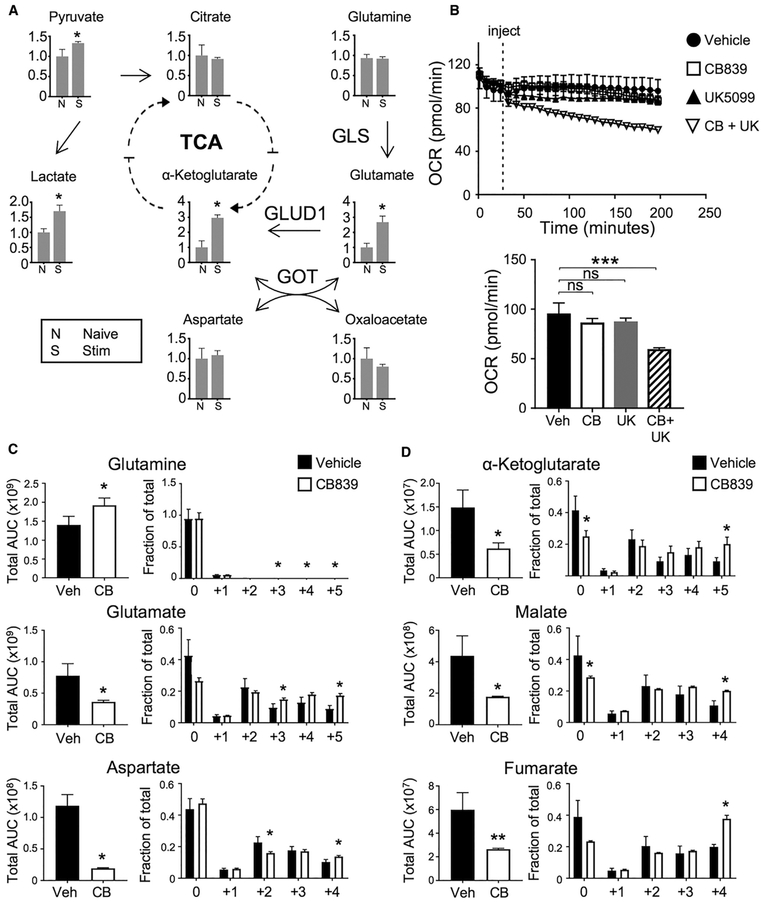
Figure 1. Activated T Cells Rely on Both Glucose and Glutamine to Sustain Cell Metabolism.
(A) Metabolites extracted for mass spectrometry and presented as fold change from naive in T cells stimulated for 16 hr (S) or naive (N) conditions (one-way ANOVA).
(B) Oxygen consumption rate (OCR) assayed from naive CD4 cells from wild-type (WT) mice stimulated for 3 days on αCD3/CD28, injected with drug described (top). OCR at time point 200 min (bottom, one-way ANOVA).
(C and D) Abundance of metabolites (left, unpaired t test) and fractional labeling (right, one-way ANOVA) of stimulated CD4+ T cells in the presence of CB839 and 13C-glucose for glutaminolytic intermediates (C) and TCA intermediates (D).
Also see Figure S1.

