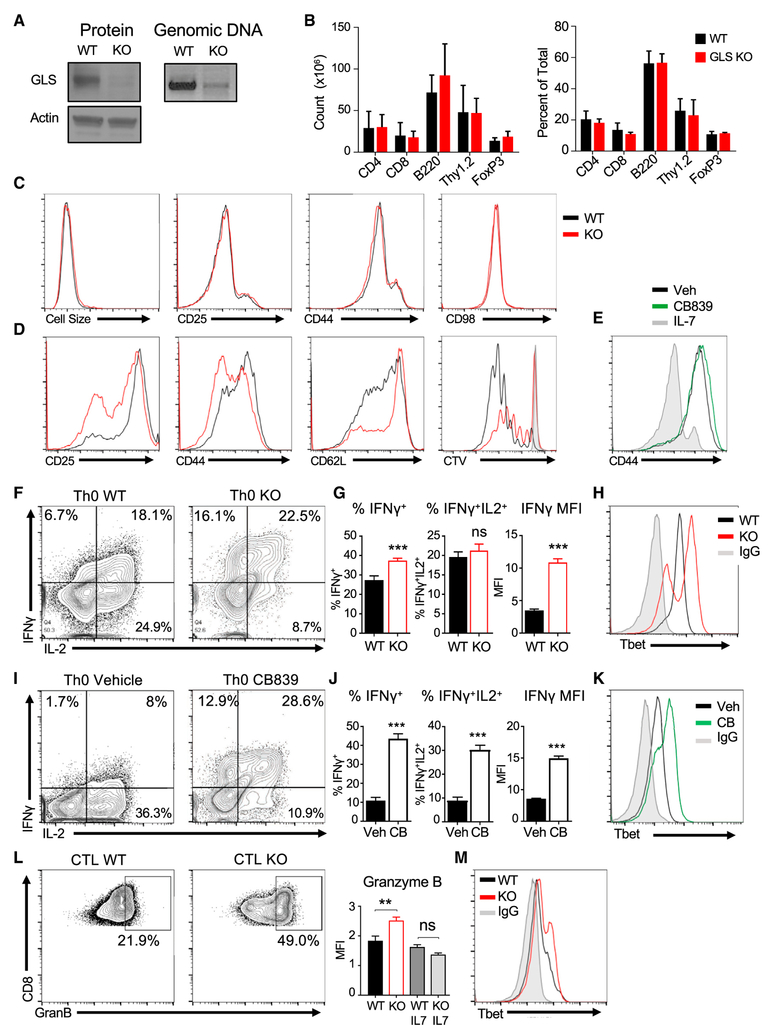
Figure 3. GLS Is Dispensable for T Cell Homeostasis but Constrains Development of a Th1-like Phenotype.
(A) Immunoblot (left) and genomic DNA (right) in isolated Pan T cells (CD4+ and CD8+) from GLSfl/fl CD4-Cre+ (GLS KO) and littermate wild-type controls (WT).
(B) Cell counts (left) and percent of total splenocytes (right) from WT and GLS KO animals. No significance versus wild-type, one-way ANOVA.
(C and D) Flow cytometry analysis of T cell activation markers and cell size of CD4+ T cells (C) freshly isolated from WT and GLS KO T spleens or (D) activation markers and proliferation of WT and GLS KO CD4+ T cells activated on αCD3/CD28 over 48 hr.
(E) Flow cytometry analysis of CD44 in CB839- or vehicle-treated T cells activated on αCD3/CD28 at day 5.
(F–K) Naive CD4+ T cells activated without cytokines over 3 days, split with IL-2, then stimulated to measure cytokines on day 5. (F) Cytokine production of wild-type and GLS KO T cells. (G) Average percent total IFNγ+ producers (left), percent double positive IFNγ+IL2+ producers (middle), and the median fluorescence intensity (MFI) (right) of all IFNγ+ cells in (F) (unpaired t test). (H) Tbet protein expression in WT, GLS KO, and isotype control T cells. Representative of n = 2 experiments. (I–K) Same as in (F–H), except with GLS-inhibitor CB839 and vehicle.
(L and M) CD8+ T cells from WT or GLS KO animals activated on αCD3/CD28 + IL2 for 5 days. (L) Expression of CD8+ granzyme B protein at day 5 (left) and average of granzyme B MFI signal (right) (Student’s t test, n = 3 replicates/group). (M) Tbet protein expression in WT, GLS KO, and isotype control (representative of n = 2 experiments).
Also see Figure S3.

