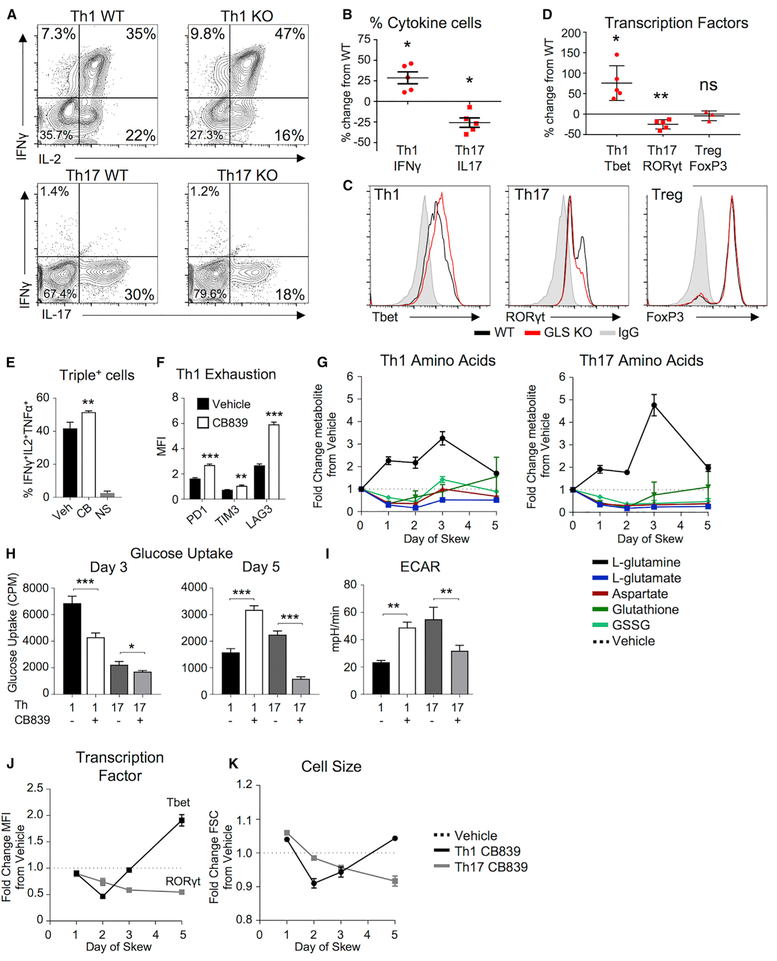
Figure 4. GLS Specifies Th1 and Th17 Differentiation and Metabolism.
(A–D) Naive CD4+ T cells from WT and GLS KO T cells differentiated in Th1-, Th17-, or Treg-skewing media over 5 days. (A) IFNγ and IL2 production in Th1-skewing conditions (top) and IL-17 production in Th17-skewing conditions (bottom). (B) Average percent change cytokine producers in Th1 and Th17 cells from WT (paired t test). (C) Transcription factor expression of Th1, Th17, and Treg cells in WT (black) and GLS KO (red). (D) Average percent change from WT of transcription factors (one-sample t test) in GLS KO T cells.
(E–K) WT CD4+ T cells differentiated in Th1 or Th17 conditions in the presence of vehicle or CB839 over 5 days. (E) Percent of Th1 cells producing IFNγ, IL2, and TNFα at day 5 (unpaired Student’s t test; NS, no stim). (F) Median fluorescence intensity of inhibitory receptors (two-way ANOVA). (G) Fold change of metabolites from T cells differentiated in Th1 and Th17 conditions in the presence of CB839 relative to vehicle by mass spectrometry over 5 days. (H) 3H-2-deoxyglucose uptake in Th1- and Th17-skewed T cells at day 3 (left) and day 5 (right) (Student’s t test). (I) Extracellular acidification rate (ECAR) of Th1- and Th17-skewed T cells at day 5 as in (H). (J) Fold change of Tbet (Th1) or RORyt (Th17) protein levels and (K) cell size in CB839-treated cells normalized to vehicle from same experiment as (G).
Also see Figure S4.

