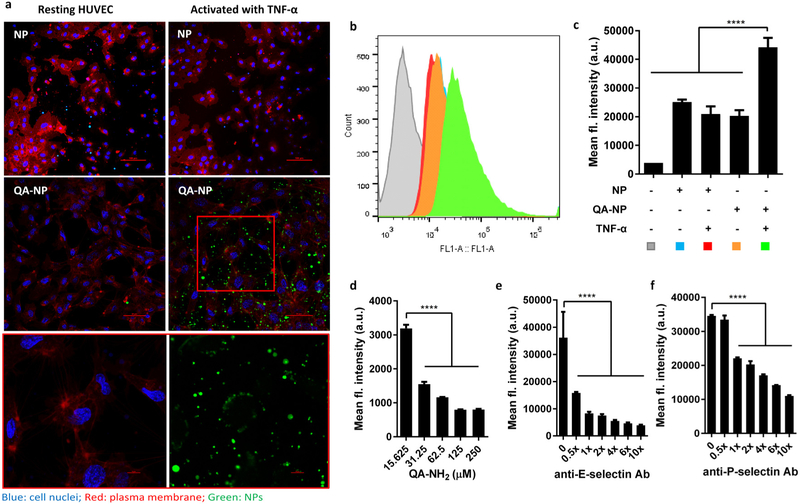
Figure 2.
(a) Confocal imaging of FITC-labeled NP and QA-NP incubated with resting or TNF-α-activated HUVECs. Green: NPs; blue: cell nuclei; red: plasma membrane. The box in QA-NP/activated HUVEC image was magnified at the bottom in two channels. (b) Representative flow cytometry histogram. (c) Quantitative measurement of HUVECs interacting with NP or QA-NP (n = 3 tests of a representative batch, mean ± s.d.). ****: p<0.0001 vs. QA-NP with TNF-α activated HUVEC by Dunnett’s multiple comparisons test. Competitive inhibition of QA-NP binding to HUVECs by (d) free QA-NH2; (e) anti-E-selectin antibody; and (f) anti-P-selectin antibody. QA-NP to HUVEC binding was quantified by flow cytometry. (n = 3 tests of a representative batch, mean ± s.d.). ****: p<0.0001 by Dunnett’s multiple comparisons test. The experiment was repeated with an independently and identically prepared batch of QA-NP, and the results are presented in Figure S8.

