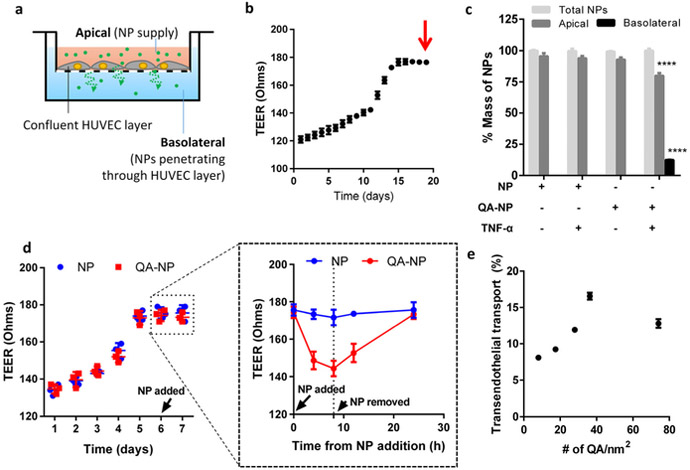
Figure 3.
(a) Schematic diagram of transendothelial transport of NPs. (b) Representative TEER plot of HUVEC monolayer. The arrow indicates the time of NP addition. (c) The percentage of NP transport across the confluent HUVEC monolayer with and without TNF-α activation (n = 3 test of a representative batch, mean ± s.d.). ****: p<0.0001 vs. NP with non-activated HUVECs in each compartment by Holm-Sidak’s multiple comparisons test. (d) Representative TEER plot of HUVEC monolayer with values measured at shorter intervals from the time NP was added. The plot in a dashed box was magnified on the right. (e) Relationship between the ligand density and the transendothelial transport of QA-NP (n = 3 tests of a representative batch, mean ± s.d.).

