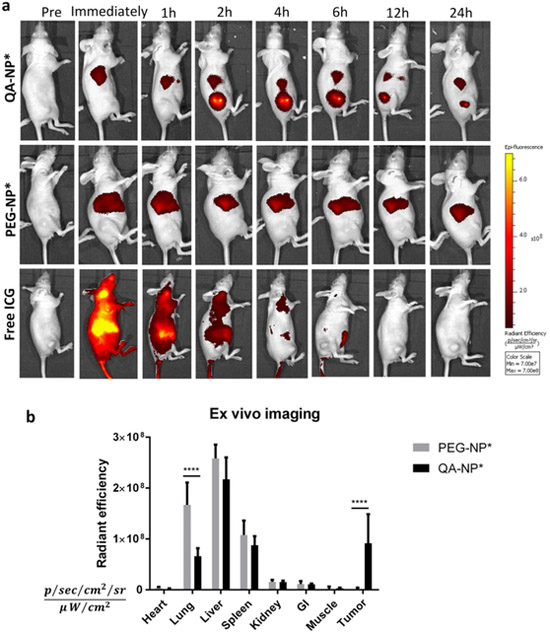
Figure 5.
(a) Representative whole body imaging of animals over 24 h from the injection of each treatment. Animals bearing subcutaneous MDA-MB-231 tumor xenografts were treated with QA-NP* (top), PEG-NP* (middle), and free ICG (bottom) by tail vein injection. See Figure S16 for all animals receiving the treatments. (b) Fluorescence intensity of ex vivo images of major organs retrieved at the end of whole body imaging (24-h post-injection). n=5 mice per group. ****: p<0.0001 by Bonferroni's multiple comparisons test following two-way ANOVA.

