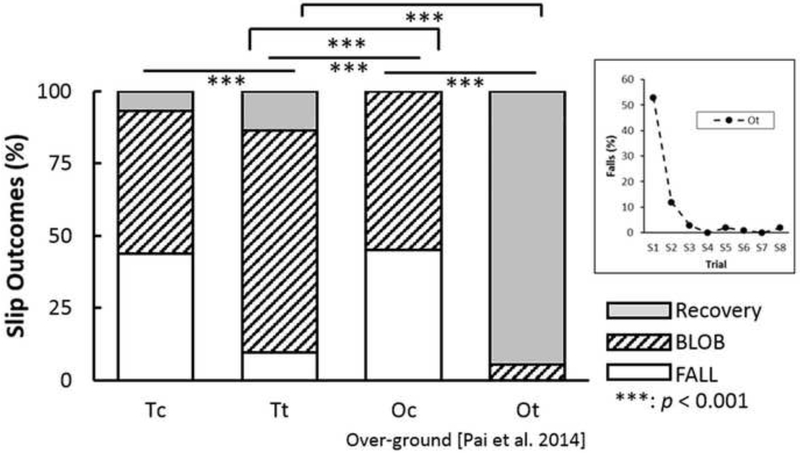
Figure 5.
Slip recovery outcomes and their percentages of falls (FALL, unfilled bar), backward loss of balance (BLOB, hatched lines), and full recovery (FULL, light grey) within the four groups. Significant differences were indicated with a solid line (*** = p < 0.001). Shown in the sub-plot at the right corner is the change in the incidence of falls (S1 through S8) in over-ground-slip-training group (Ot: over-ground-slip-training group).

