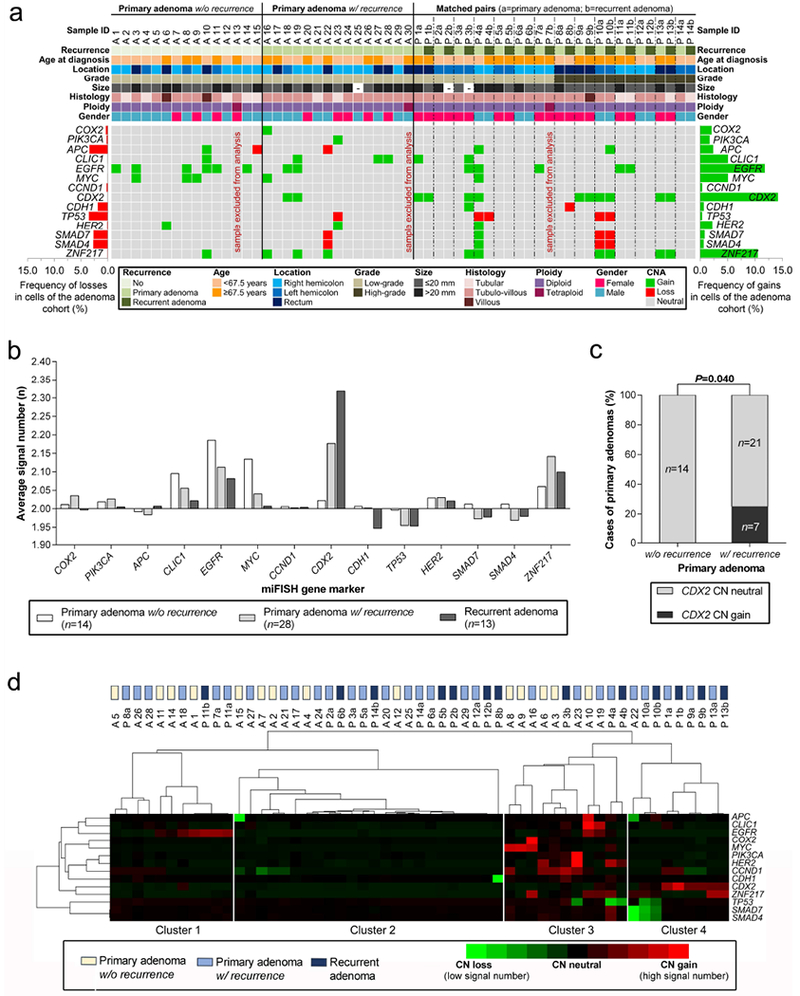
Figure 2.

Summary of copy number alterations identified by miFISH. (a) Clinicopathological features (rows, upper panel) and miFISH gene marker status (rows, lower panel) are plotted per individual adenoma sample (columns). (b) Average signal numbers of the fourteen gene probes in primary adenomas without and with recurrence and in recurrent adenomas showed no statistically significant differences across the groups but revealed a trend for CDX2 only (p=0.102; one-way ANOVA). (c) CDX2 was exclusively gained in primary adenomas with recurrence compared to primary adenomas without recurrence (Chi square test). (d) Heat map cluster analysis of average signal numbers per marker in each patient. Genes and samples were sorted by dendrogram correlation. Adenomas were divided into four clustering groups. Cluster assignment showed a trend to separate adenomas without recurrence from primary adenomas with recurrence (p=0.193, Freeman-Halton test).
