
Figure 4. Relationship between the HbA1c groups (left panel) or number of cardiac autoantibodies (right panel) during DCCT and hsCRP levels during EDIC years 4–6.
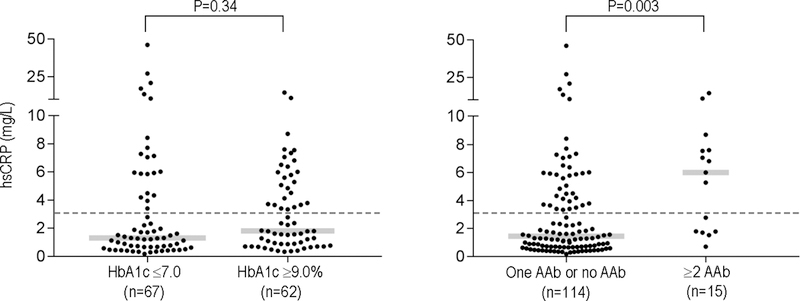
hsCRP, high-sensitivity C-reactive protein. Gray bars indicate the medians in the different groups and dotted lines indicate the upper reference limit for hsCRP (3.0 mg/L). P values refer to the comparison of log-transformed values.