
Figure 2.
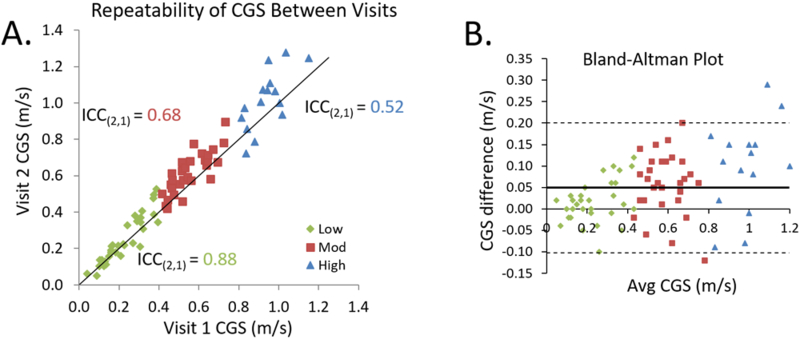
A) Reliability of comfortable gait speed between visits one and two. Individual participants are plotted against a unity line and are divided into speed-based classification groups (LOW: diamonds; MOD: squares; HIGH: triangles). The subject groupings were chosen using 0.40 and 0.80 m/s thresholds. B) Bland-Altman plot shows greater variability in faster walkers compared to slower walkers. The thick solid line represents the mean difference between sessions and the dashed lines represent the limits of agreement.