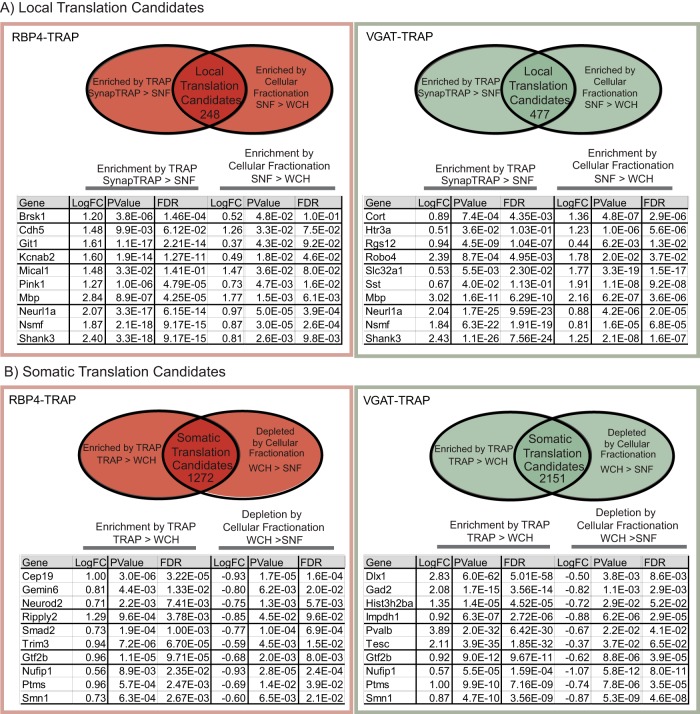
Figure 3.
SynapTRAP identifies local translation candidate transcripts for both RBP4 and VGAT-TRAP. A, Tables of 10 representative local translation candidate transcripts from each of the cell types and Venn diagrams illustrating the analysis conditions used to generate each list of candidates. B, Tables of 10 representative somatic candidates from each of the cell types and Venn diagrams illustrating the analysis conditions used to generate each list of candidates. Figure 3-1: Table of RBP4 Local Translation Candidates. Figure 3-2: Table of VGAT Local Translation Candidates. Figure 3-3: Table of RBP4 Somatic Translation Candidates. Figure 3-4: Table of VGAT Somatic Translation Candidates.

