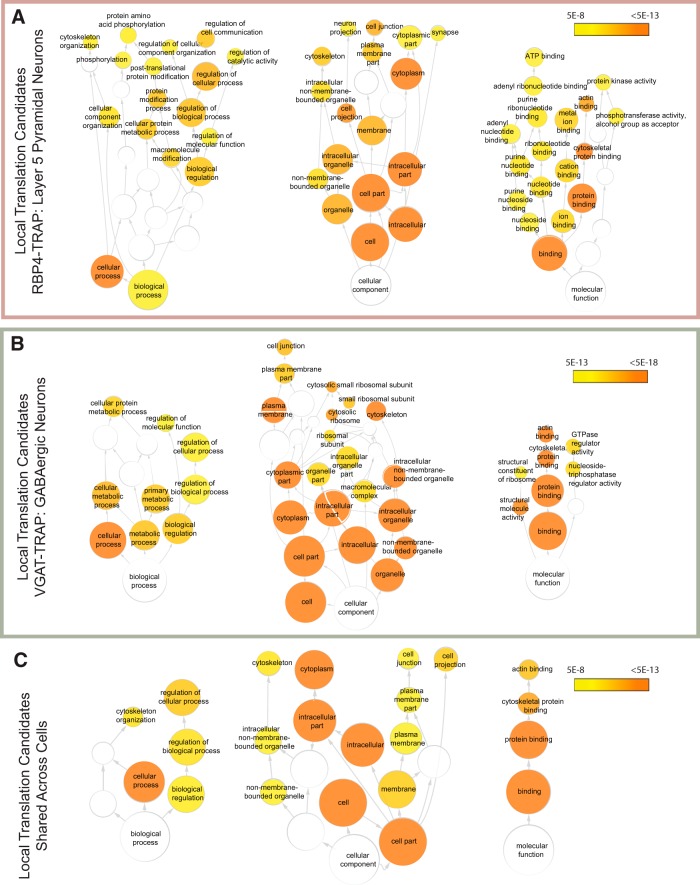
Figure 4.
Pathway analysis of local translation candidates. A, A gene ontologies pathway analysis of local translation candidates from the RBP4-TRAP data representing pyramidal neurons reveals significant enrichment of a variety of functional gene categories. Colored nodes represent significant categories and are organized hierarchically from broadest categories (bottom of each tree) to most specific. B, A gene ontologies analysis of local translation candidates from the VGAT-TRAP mouse line, representing GABAergic neurons reveals enrichment in cytoskeletal elements and ribosomal proteins, among other categories. C, A gene ontologies analysis of those transcripts found as local translation candidates in both VGAT-TRAP and RBP4-TRAP mouse lines (intersect) reveals a common theme of cytoskeletal elements. The color key indicates the significance of hypergeometic testing after Benjamini–Hochberg multiple testing correction. Only categories with p < 10E-8 (A, C) or p < 10E-13 are shown (B). Figure 4-1: GO analysis results of RBP4 local translation candidates with a significance cutoff p = 5E-8. Figure 4-2: GO analysis results of VGAT local translation candidates with a significance cutoff p = 5E-8. Figure 4-3: GO analysis results of shared local translation candidates with a significance cutoff p = 5E-8. Figure 4-4: GO analysis results of RBP4 TRAP vs WCH enriched transcripts with a significance cutoff p = 5E-8. Figure 4-5: GO analysis results of VGAT TRAP vs WCH enriched transcripts with a significance cutoff p = 5E-8.

