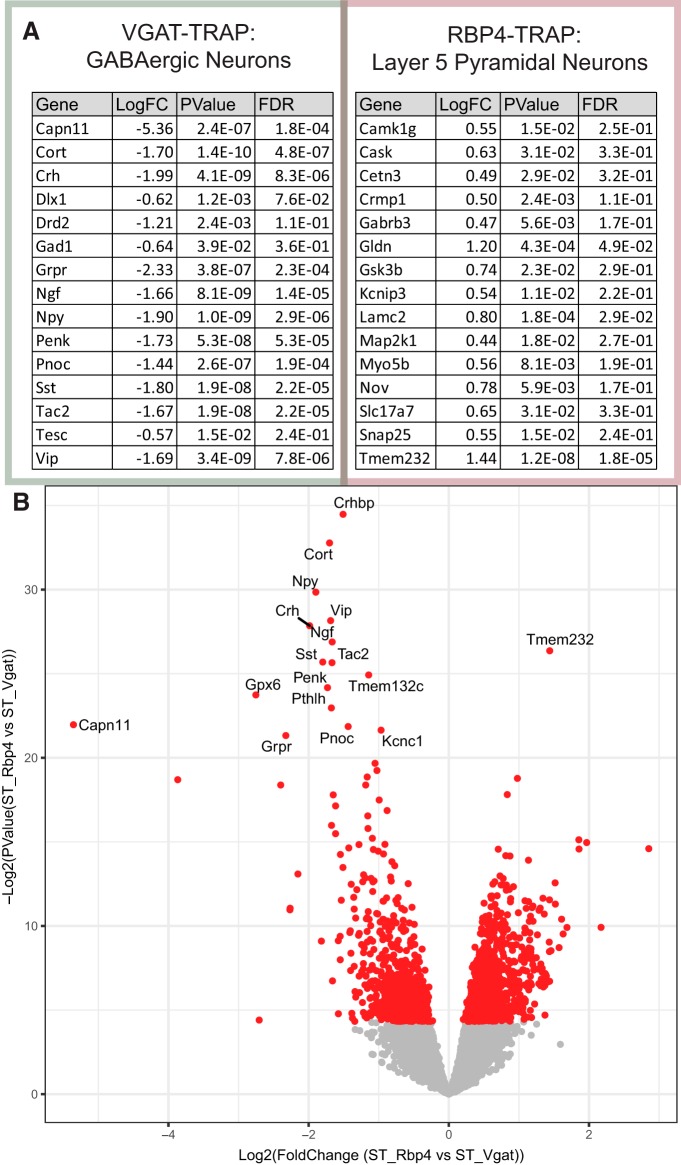
Figure 6.
Direct comparison reveals quantitative differences in SynapTRAP between RBP4 and VGAT neurons. A, Table of 15 representative neurons with quantitative differences between the local translatome of the cell types as identified by a directed differential expression of ST samples. B, Volcano plot of differential expression results from the direct comparison of ST between cell types. Genes with significant differences between cell types (p < 0.05) are shown in red. Figure 6-1: Table of Cell Type Specific Local Translation Candidates in Pyramidal Neurons (RBP4-TRAP). Figure 6-2: Table of Cell Type Specific Local Translation Candidates in GABAergic Neurons (Vgat-TRAP).

