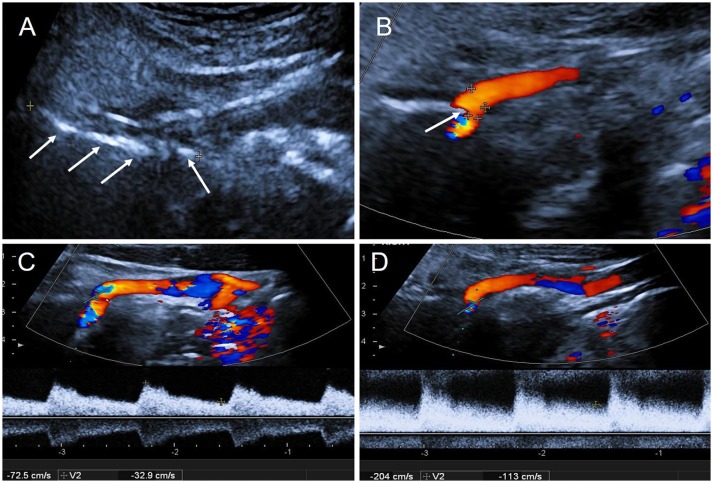
Figure 3.
The results of CDFI during the second hospitalization. (A) Two-dimensional gray-scale imageing showed a long hyperechoic segment on the right side of neck: styloid process (arrows); (B) CDFI showed the right ICA was oppressed by the styloid process (arrow); (C) The blood flow velocity in right ICA in normal position: PSV = 72 cm/s, EDV = 33 cm/s; (D) The blood flow velocity in right ICA increased when the patient slowly turned head to the right: PSV = 204 cm/s, EDV = 113 cm/s. PSV, peak systolic velocity; EDV, end diastolic velocity.

