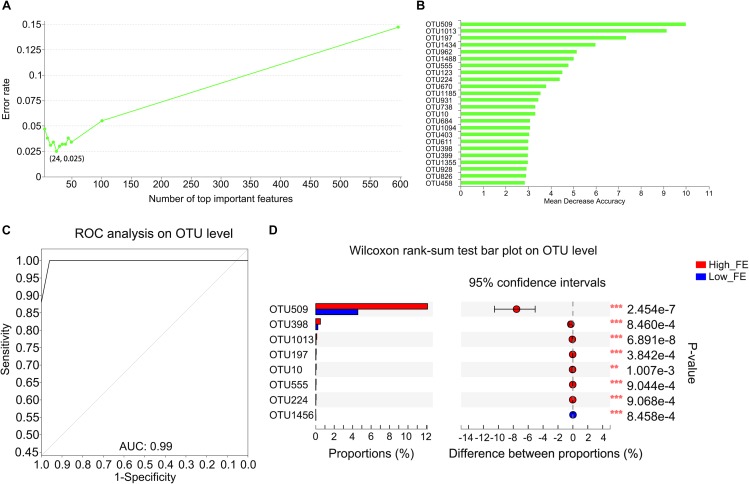
FIGURE 3.
Important biomarkers selected by random forest analysis and the different abundance of OTUs in high- and low-FE pigs. (A) Model evaluation by using top important variables. The horizontal axis represents the number of variables ranked by importance. The vertical axis denotes the average prediction error rate using 10-fold cross-validation when using the number of corresponding variables. (B) The ordination diagram of variables of importance. The horizontal axis is the measurement standard of variables of importance, and the value is equal to the measurement value of variables of importance/standard deviation. The vertical axis is the variable names sorted by importance. (C) ROC of the random forest classifier based on the 24 most important variables. The AUC value is the area under the corresponding curve. When the AUC > 0.5, the AUC value is closer to 1, the diagnostic effect is better. (D) The OTUs with a significantly different abundance between high- and low-FE pigs detected by STAMP software.

