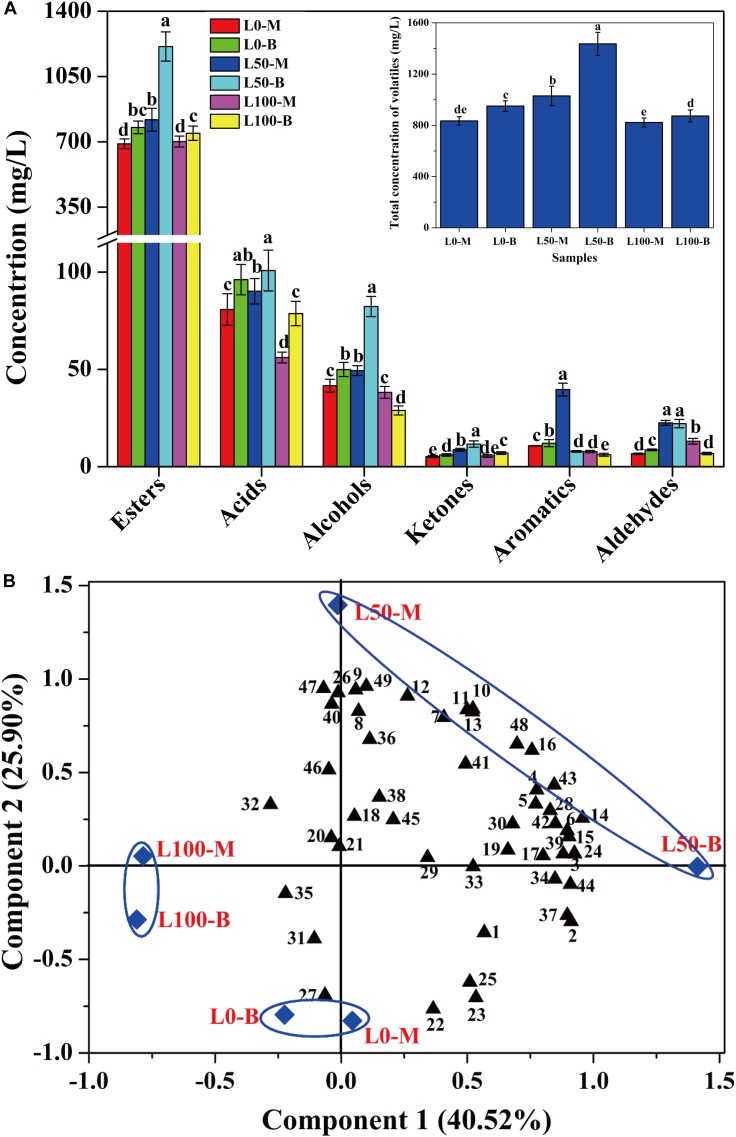
FIGURE 5.
Concentration variation (A) and principal components analysis (B) of volatile compounds in liquors distillated from different FG. Different letters obtained by ANOVA indicate significant differences at p < 0.05 (n = 3). Each number in the atlas represents 1 compound, listed successively in Supplementary Table S3.

