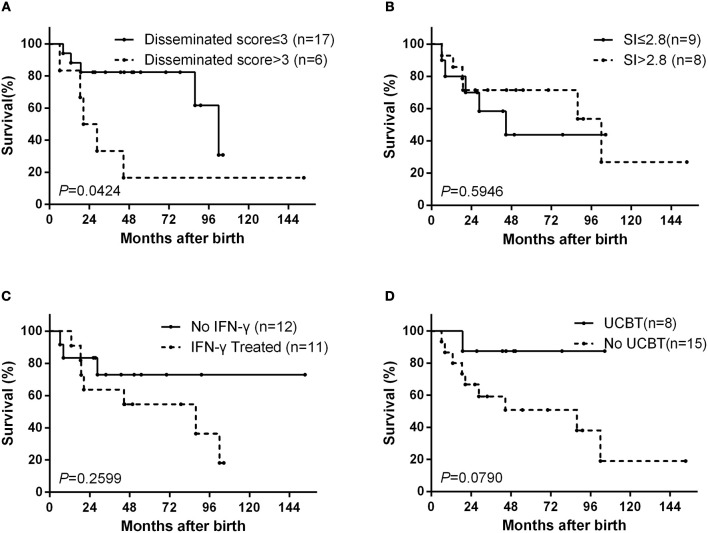
Figure 2.
Kaplan–Meier survival curves from the date ot birth. The curves are shown for (A) according to dissemination score, (B) according to the dihydrorhodamine assay stimulation index (SI), (C) according to interferon (IFN)-γ treatment status, and (D) according to umbilical cord blood transplantation (UCBT) status.

