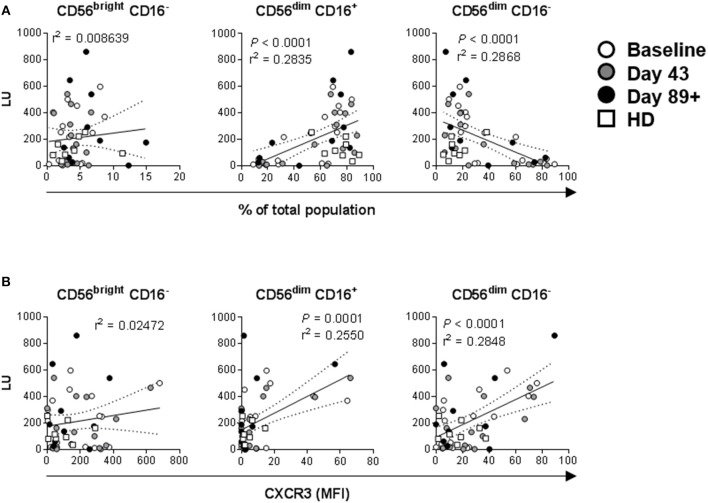
Figure 9.
Correlations between NK cell lytic ability, distribution of the three major NK cell subsets, and expression levels of activation markers. Complementary data values acquired for each of the donors and time-points were evaluated. (A) Correlations between LU (Figure 7) and distribution values for each of the three major NK cell subsets based CD56 and CD16 expression levels (Figures 2A, 4A, 6A, Supplemental Figure 3A) are shown. P-values are shown in red color. (B) Correlations between LU and CXCR3 MFI levels (Figures 3, 5, 7, Supplemental Figure 4) measured on the three NK cell subsets is shown.

