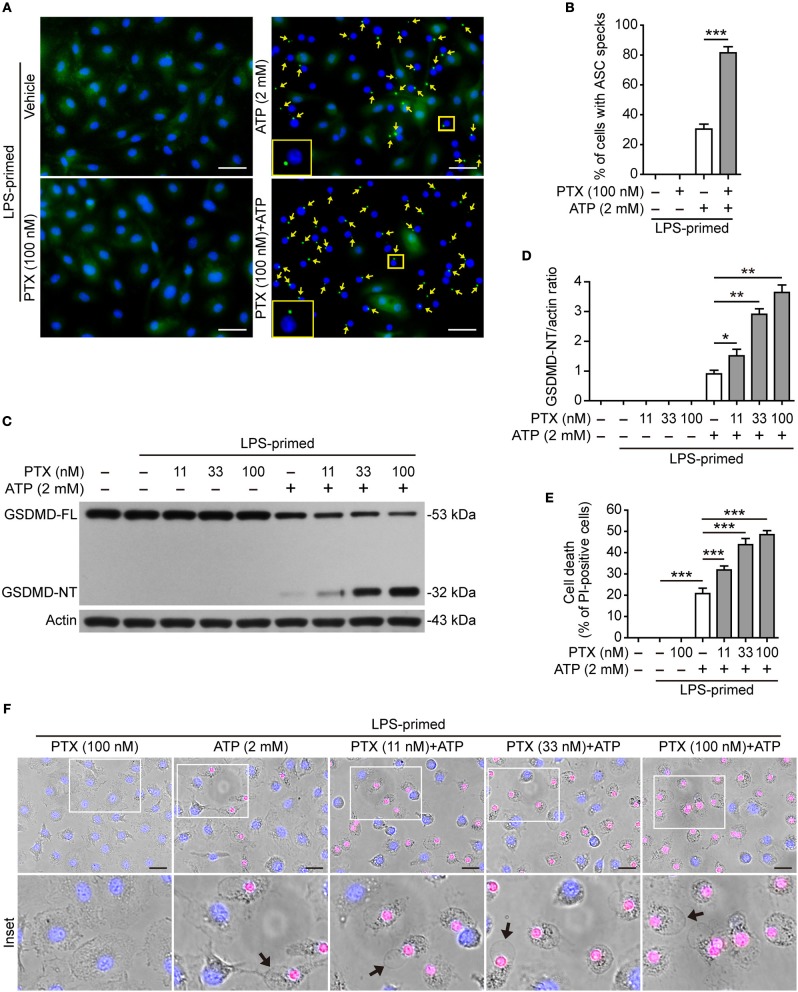
Figure 2.
Paclitaxel increased ATP-induced ASC speck formation and pyroptosis in bone marrow-derived macrophages (BMDMs). LPS-primed BMDMs were pre-treated with indicated concentrations of paclitaxel for 1 h, followed by incubation with ATP (2 mM) for 30 min without LPS. (A) ASC expression and subcellular distribution were revealed by fluorescence microscopy. Representative images (40×) showing ASC (green) subcellular distribution. Nuclei were revealed by Hoechst 33342 (blue). The images for ASC and nuclei were captured under a fluorescence microscope, respectively, and merged together. Yellow arrows indicate ASC specks and the enlarged inset showing a cell containing an ASC speck. Scale bars, 20 μm. (B) Percentages of cells with an ASC speck relative to the total cells from 5 random fields each containing ~50 cells. Data were analyzed using the unpaired Student's t-test, which are shown as mean ± SD (n = 5, one field per well). ***P < 0.001. (C) Western blotting was used to detect indicated proteins in cell lysates. Actin was used as the loading control. (D) Histograms show the quantification of GSDMD-NT levels relative to that of actin. Data were analyzed using the non-parametric Mann–Whitney U-test, which are shown as mean ± SD (n = 3). (E, F) Cell death was assayed by propidium iodide (PI) (red; staining dead cells) and Hoechst 33342 staining (blue; staining all cells) for 10 min. PI-positive cells in 5 randomly chosen fields (one field per well) each containing ~100 cells were quantified (see Figure S3A). (E) The percentage of cell death is defined as the ratio of PI-positive relative to all cells (revealed by Hoechst 33342). Data were analyzed using the one-way ANOVA followed by Turkey post hoc test, which are shown as mean ± SD (n = 5). (F) Merged images showing PI (red) and Hoechst 33342 (blue) fluorescence combined with bright-field images. The enlarged insets show the cell morphology. One set of representative images of three independent experiments is shown. Black arrows indicate one dying cell with ballooning from the plasma membrane in each image. Scale bars, 20 μm. GSDMD-FL, full-length GSDMD; GSDMD-NT, GSDMD N-terminal fragment; PTX, paclitaxel. *P < 0.05; **P < 0.01; ***P < 0.001.

