Figure 4.
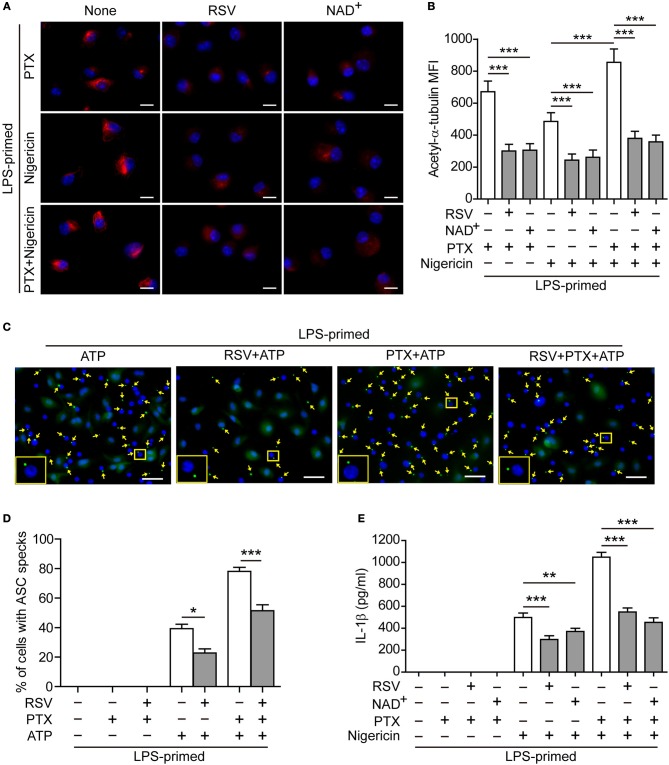
Resveratrol and NAD+ suppressed paclitaxel-mediated augmentation of NLRP3 inflammasome activation. (A,B) LPS-primed BMDMs were pre-treated without (None) or with resveratrol (5 μM) or NAD+ (10 μM) for 30 min before incubation with paclitaxel (33 nM) for 1 h and then stimulation with nigericin (5 μM) for 1 h. After staining with indicated antibodies, the cells were observed by fluorescence microscopy and the images were captured, respectively, and merged together. Representative immunofluorescence images showing acetylated α-tubulin (red) subcellular distribution (A). Nuclei (blue) were revealed by Hoechst 33342. Scale bars, 10 μm. (B) Mean of fluorescence intensity (MFI) of acetylated α-tubulin was analyzed by ZEN software. Data were analyzed using the non-parametric Friedman test, which are shown as mean ± SD (n = 5). (C–E) LPS-primed BMDMs were pre-treated with resveratrol (5 μM) (C, D) or NAD+ (10 μM) (E) for 30 min prior to paclitaxel (100 nM) treatment for 1 h, followed by incubation with ATP (2 mM) for 30 min. The expression and subcellular distribution of ASC were revealed by the immunofluorescent microscopy. (C) Representative images showing ASC (green) subcellular distribution. Nuclei (blue) were revealed by Hoechst 33342. Yellow arrows indicate ASC specks and the enlarged inset showing cells with an ASC speck. Scale bars, 20 μm. (D) Percentages of cells with an ASC speck relative to total cells from 5 random fields each containing ~200 cells (see Figure S7). Data were analyzed using the non-parametric Mann–Whitney U-test, which are shown as mean ± SD (n = 5). (E) Levels of soluble IL-1β in culture supernatants were analyzed by cytometric bead array (CBA) assay. Data were analyzed using the one-way ANOVA followed by Turkey post-hoc test, which are shown as mean ± SD (n = 3). *P < 0.05; **P < 0.01; ***P < 0.001; PTX, paclitaxel; RSV, resveratrol.

