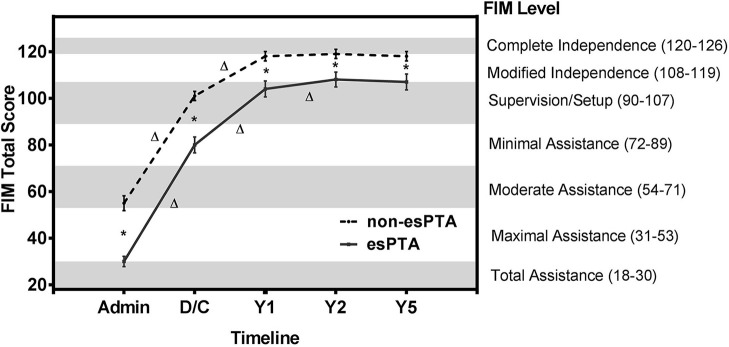
Figure 3.
FIM total scores of esPTA group and non-esPTA group at 5 time points. Line plot illustrates the change in FIM total scores across follow-up periods in the esPTA and non-esPTA groups. The non-esPTA and esPTA groups's FIM scores are plotted with FIM total scores on the left y-axis and the corresponding seven FIM levels on the right y-axis with the timeline on the x-axis.*Represents a significant (p < 0.05) difference between groups at a single time point, and Δ represents a significant (p < 0.05) within group difference between time points. Error bars with 95% confidence intervals.

