Figure 2.
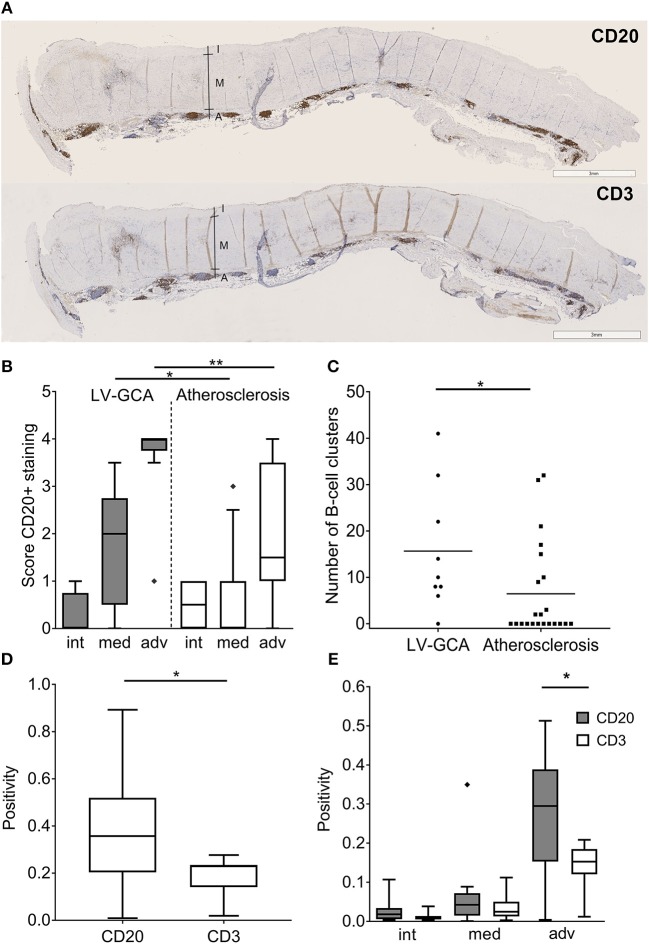
B-cells outnumber T-cells in aorta tissue from LV-GCA patients. (A) Representative images of CD20+ B-cells (upper panel) and CD3+ T-cells (lower panel) in the aorta of LV-GCA patients. I, intima; M, media; A, adventitia. (B) Semi-quantitative analysis of CD20+ B-cell abundance in aorta of LV-GCA and atherosclerosis patients for the intima (int), media (med), and adventitia (adv). Scoring was performed on a 5-point scale with 0 = no positive cells, 1 = occasional positive cells, 2 = moderate number of positive cells, 3 = large number of positive cells (clusters), 4 = very large number of positive cells. (C) The number of B-cell clusters (semi-quantitative score ≥3) in the tissue per patient. The line depicts the median. (D) Overall CD20 and CD3 positivity for the aorta, as quantified by pixel count of tree representative areas per tissue (n = 9). (E) CD20 and CD3 expression for the intima, media and adventitia of the aorta as quantified by pixel count. Three representative areas per tissue (n = 9) were analyzed. In the box and whisker plots (Tukey), boxes indicate median values and interquartile ranges. The Mann-Whitney U-test was used to compare both groups in (B,C), the Wilcoxon signed rank test was used in (D,E). *P < 0.05, **P < 0.01.

