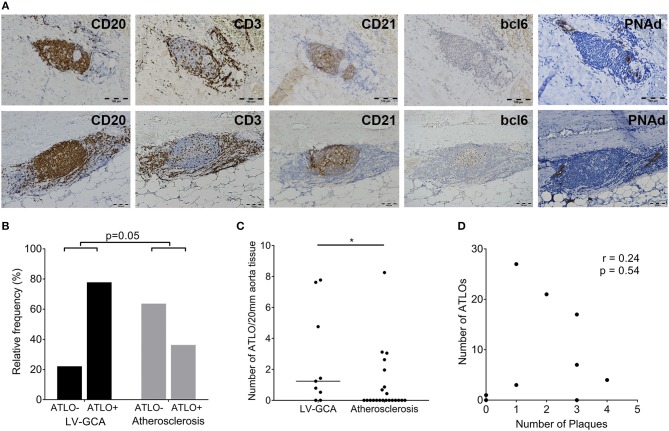
Figure 3.
ATLOs in the aorta of LV-GCA and atherosclerosis patients. (A) Representative images of consecutive sections of aorta tissue showing in brown B-cells (CD20), T-cells (CD3), FDC (CD21), GCs (bcl6), and HEV (PNAd). The upper panel shows an ATLO without GC (bcl6–) and the lower panel an ATLO with GC (bcl6+). (B) Relative frequency of patients with ATLOs (ATLO+) and without ATLOs (ATLO–) in the aorta for both LV-GCA and atherosclerosis patients. (C) Number of ATLOs per 20 mm of aortic tissue for both LV-GCA and atherosclerosis patients. (D) Lack of association between atherosclerosis (number of plaques) and the number of ATLOs for LV-GCA patients. Fischer's exact test was used in (B), Mann-whitney U-test in (C) and Spearmans r was used for (D). *P < 0.05.

