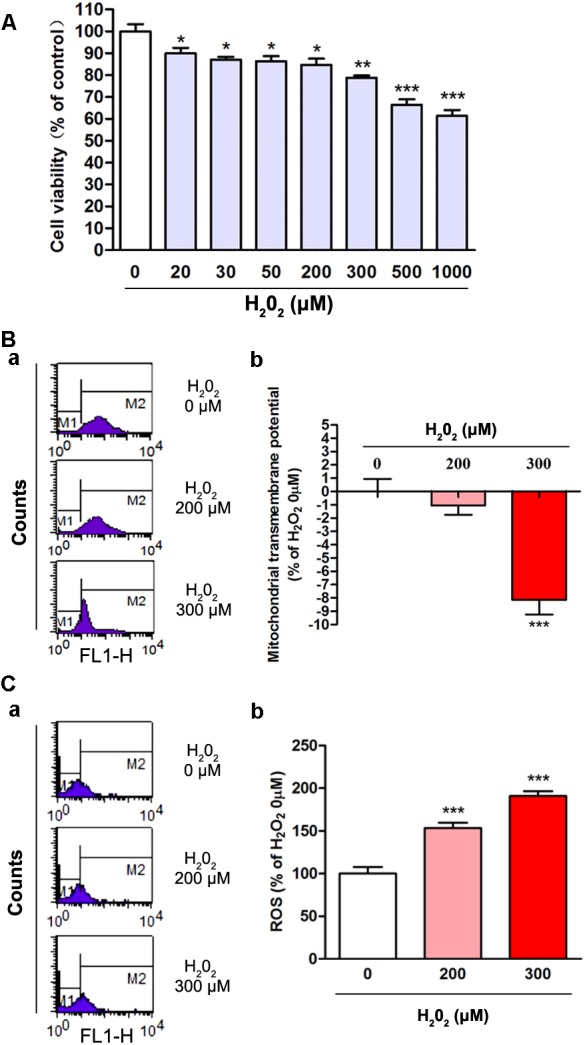
FIGURE 1.

The oxidative effects of different concentrations of H2O2 on SH-SY5Y cells. (A) Cell viability was changed with the increased concentration of H2O2 treatment. Cell viability of the 0 μM H2O2 group was set to 100%. Data were presented as mean ± SEM of 6 independent experiments. ∗P < 0.05, ∗∗P < 0.01, and ∗∗∗P < 0.001 compared with 0 μM H2O2 group. (B) Fluorometric assay on ΔΨm in different groups (a) and statistical analysis (b). ΔΨm was decreased with the increased concentration of H2O2. Fluorescence values of the 0 μM H2O2 was set to 0. Data were presented as mean ± SEM of 6 independent experiments. ∗∗∗P < 0.001 compared with H2O2 0 μM group. (C) Fluorometric assay on ROS levels in different groups (a) and statistical analysis (b). Fluorescence values of the 0 μM H2O2 group was set to 100%. Data were presented as mean ± SEM of 4 independent experiments. ∗∗∗P < 0.001 compared with 0 μM H2O2 group.
