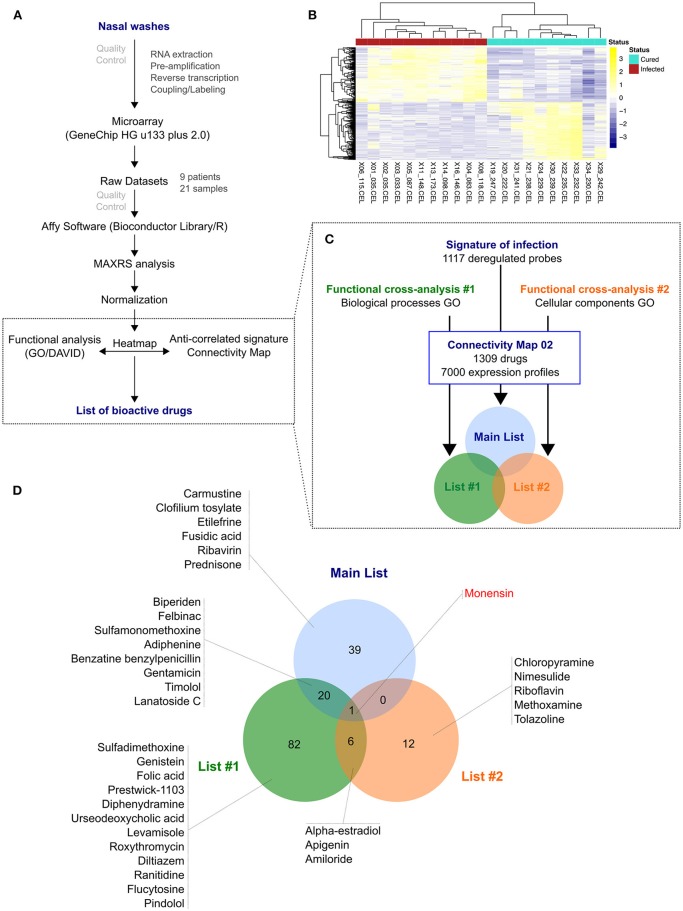
Figure 1.
From nasal wash clinical samples to a shortlist of 35 candidate molecules. (A) Overview of the in silico strategy used in this study. A detailed description of the strategy is described in the Online Methods section. (B) Hierarchical clustering and heatmap of the 1,117 most differentially deregulated genes between “infected” (red) and “cured” (light green) samples. Raw median centered expression levels are color coded from blue to yellow. Dendrograms indicate the correlation between clinical samples (columns) or genes (rows). (C) Functional cross-analysis of candidate molecules obtained from Connectivity Map (CMAP). Three lists of candidate molecules were obtained using different set of genes in order to introduce functional bias and add more biological significance to this first screening: a Main List based on the complete list of differentially expressed genes, and two other lists (List #1 and #2) based on subsets of genes belonging to significantly enriched Gene Ontology (GO) terms. (D) Venn Diagram comparing the total 160 molecules obtained from the three lists described in (C), with monensin as the only common molecule. Only the candidates selected for in vitro screening and validation are depicted.

