Figure 6.
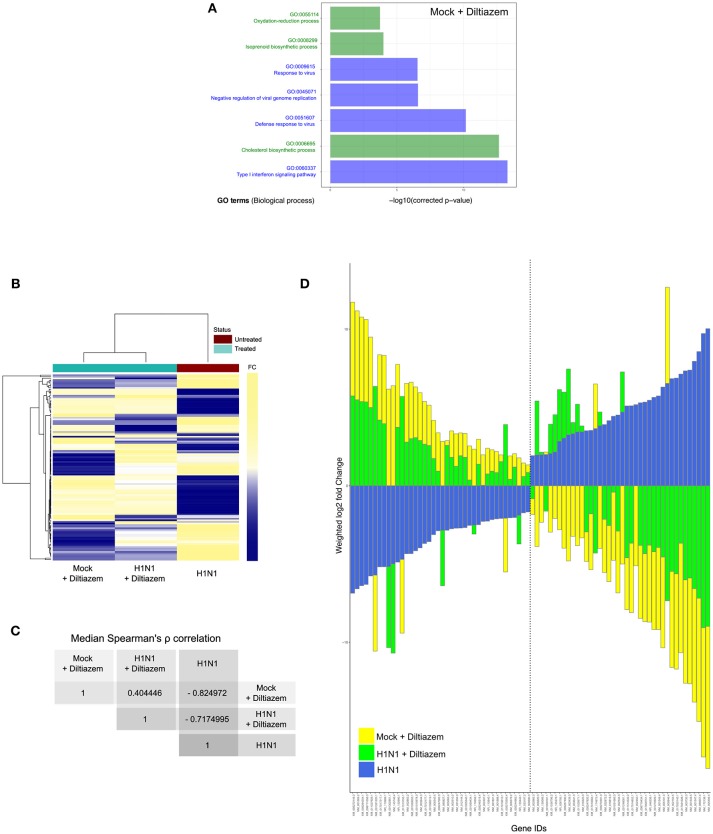
Diltiazem treatment effectively induces significant reversion of the viral infection signature. (A) DAVID gene enrichment analysis of the diltiazem transcriptional signature. The seven most significant biological processes (BP) are presented. BP related to antiviral response and cholesterol biosynthesis/metabolism are represented in blue and green, respectively. (B) Hierarchical clustering and heatmap of the 118 common differentially expressed transcripts (absolute fold change >2, Benjamini-Hochberg corrected p-value < 0.05) between mock-infected/diltiazem (“mock + diltiazem”), infected/mock-treated (“H1N1”), or infected/diltiazem (“H1N1 + diltiazem”) HAE. The mock-infected/mock-treated (“mock”) condition was used as baseline. Mean-weighted fold changes are color-coded from blue to yellow. (C) Median Spearman ρ correlation value calculations between the 3 conditions highlighted in the heatmap. (D) Stacked barplot representation of the 40 most up/down-regulated transcripts highlighted in the analysis. Barplots were constructed in R3.3.1 based on mean-weighted fold changes and ordered according to H1N1 values (blue). Mock + diltiazem and H1N1 + diltiazem conditions are represented in yellow and green, respectively.

