Figure 1.
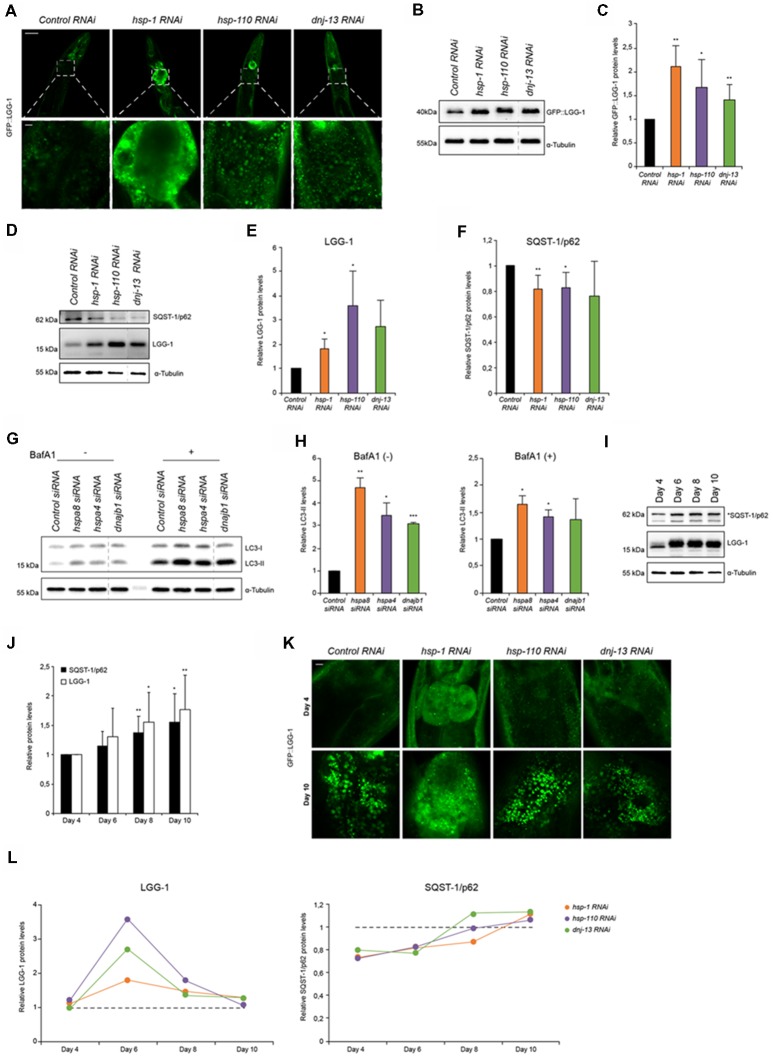
Autophagy is induced when chaperone disaggregase capacity is compromised. (A) Fluorescent images of GFP::LGG-1 animals (day 6) subjected to RNAi to deplete hsp-1, hsp-110 and dnj-13. Upper panel shows the head/intestinal region of the animals and the lower panel is a magnification of the indicated regions. Scale bars: 50 μm (upper) and 5 μm (lower panel). (B,C) Immunoblotting of GFP::LGG-1 RNAi treated animals (as in A). The error bars represent the standard deviation (SD) from a minimum of four independent experiments (B). The dashed lines indicate that some lanes were removed from the immunoblot. (D–F) Relative protein levels of LGG-1 and SQST-1/p62 from RNAi treated wild type (wt) animals (day 6). The error bars represent the SD of a minimum of three independent experiments. (G,H) Immunoblotting of siRNA transfected HEK293 cells treated with 200 nM Bafilomycin A1 (BafA1). LC3-II levels were normalized to α-tubulin levels and then to siRNA control (H). The error bars represent the SD of two independent experiments. (I,J) LGG-1 and SQST-1/p62 levels of nematodes of 4, 6, 8 and 10 days of age. Depicted are the relative LGG-1 and SQST-1/p62 levels normalized day 4 (J). The error bars represent the SD of a minimum of five independent experiments. (K) Fluorescent images of RNAi treated GFP::LGG-1 animals. The fluorescent images are a magnification of the intestinal region and were acquired at day 4 (upper) and day 10 (lower panel). Scale bars: 5 μm. (L) Relative LGG-1 and SQST-1/p62 levels of day 4, 6, 8 and 10 of RNAi treated animals. The values were normalized to the control RNAi of the respective day. Graphs represent the average values from a minimum of two independent experiments.

