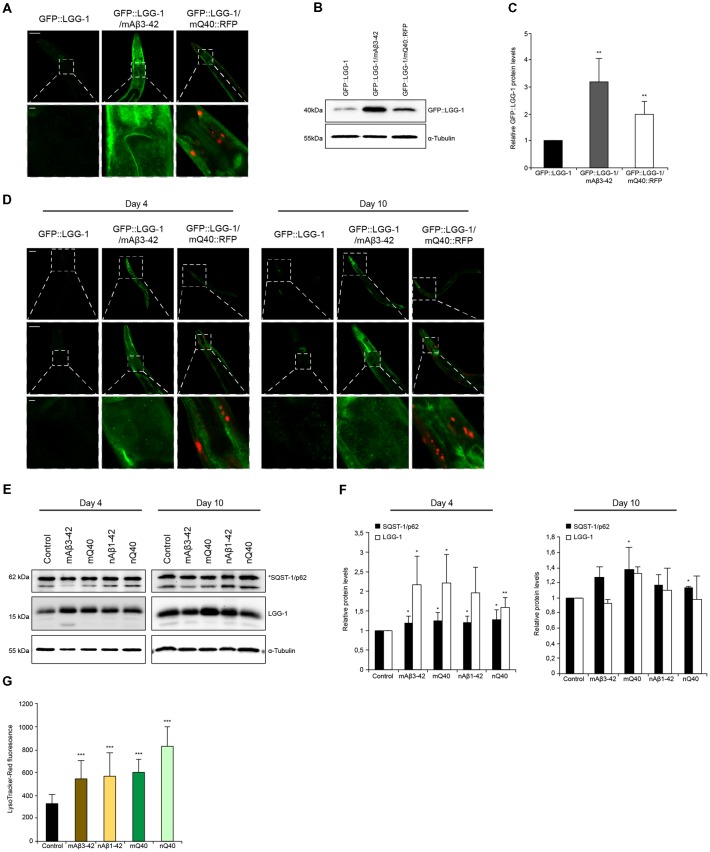
Figure 5.
Autophagy is impaired in neurodegenerative-disease C. elegans models. (A) GFP::LGG-1, GFP::LGG-1; mAβ3–42 and GFP::LGG-1; mQ40::RFP animals at day 5. The lower panel is a magnification of the head region. Scale bars: 50 μm (upper) and 5 μm (lower panel). (B,C) GFP::LGG-1 levels of control, Aβ3–42 and Q40 animals at day 5. Relative intensities of GFP::LGG-1 are shown (C). Error bars represent the standard deviation from four independent experiments. (D) GFP::LGG-1, GFP::LGG-1; mAβ3–42 and GFP::LGG-1; mQ40::RFP animals at day 4 (left panel) and day 10 (right panel). Upper, middle and lower panels show whole animal, head and a magnification of the head region, respectively. Scale bars: 20 μm (upper), 50 μm (middle) and 5 μm (lower panel). (E,F) LGG-1 and SQST-1/p62 levels of control, mAβ3–42, nAβ3–42, mQ40::RFP and nQ40::YFP day 4 and 10 old nematodes. Normalized LGG-1 and SQST-1/p62 levels. Error bars represent the SD of a minimum of three independent experiments. (G) LysoTracker staining of control, mAβ3–42, nAβ1–42, mQ40::RFP and nQ40::YFP day 4 animals. The error bars represent the SD of a minimum of 12 animals for each condition.

