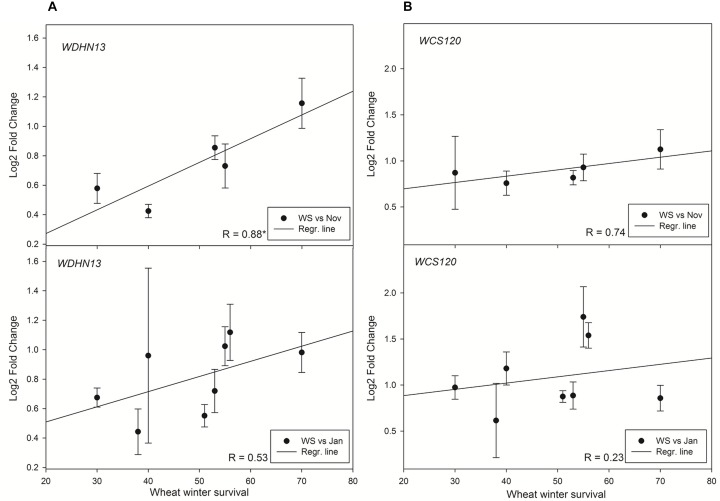
FIGURE 5.
Relationships between WS and (A) normalized relative gene expression of WDHN13 transcript and (B) normalized relative gene expression of WCS120 transcript in wheat. Asterisk marks significant correlation coefficient R (P ≤ 0.05). Abbreviations: Jan, January samplings; Nov, November samplings; WS, winter survival.

