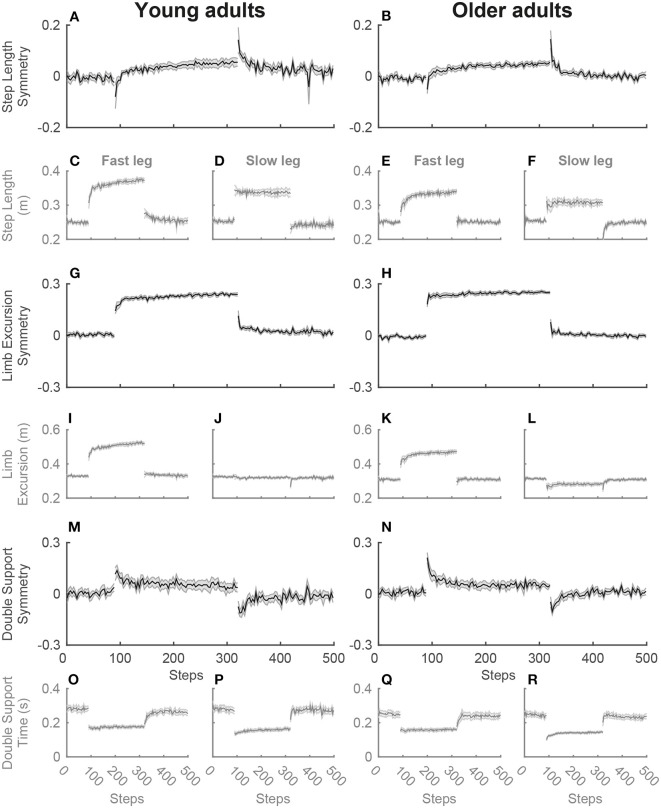
Figure 2.
Adaptation plots of the symmetry variables for young and older adults during the single-task split-belt condition. The adaptation plot shows the development of the mean and standard deviation of the symmetry variables over the split-belt condition, starting with the 90 steps of the slow baseline, then 230 steps of the adaptation phase and then the post-adaptation phase with 180 steps. The symmetry values for step length (A,B), limb excursion (G,H), and double support time (M,N) and the separate values for the fast and slow leg [step length (C–F), limb excursion (I–L), and double support time (O–R)] are shown for young (left) and older adults (right).

