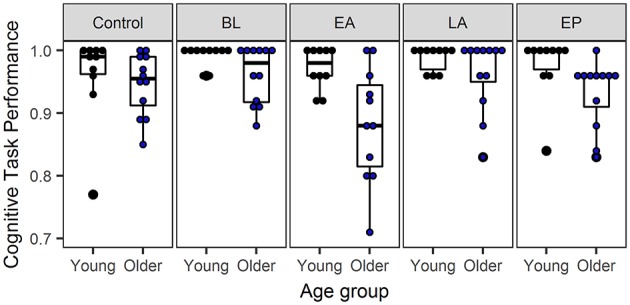
Figure 7.

Bar plot of the cognitive task performance for young and older adults. Values are shown for the control condition, sitting, and the four phases of the split-belt paradigm: baseline (BL), early adaptation (EA), late adaptation (LA), and early post-adaptation (EP). The bar plots show the median, the upper, and lower quartiles and the min and max value of the age groups. The dots show the individual data of the young (black) and older adults (blue). A value of one on cognitive task performance indicates a perfect performance.
